Fig. 1
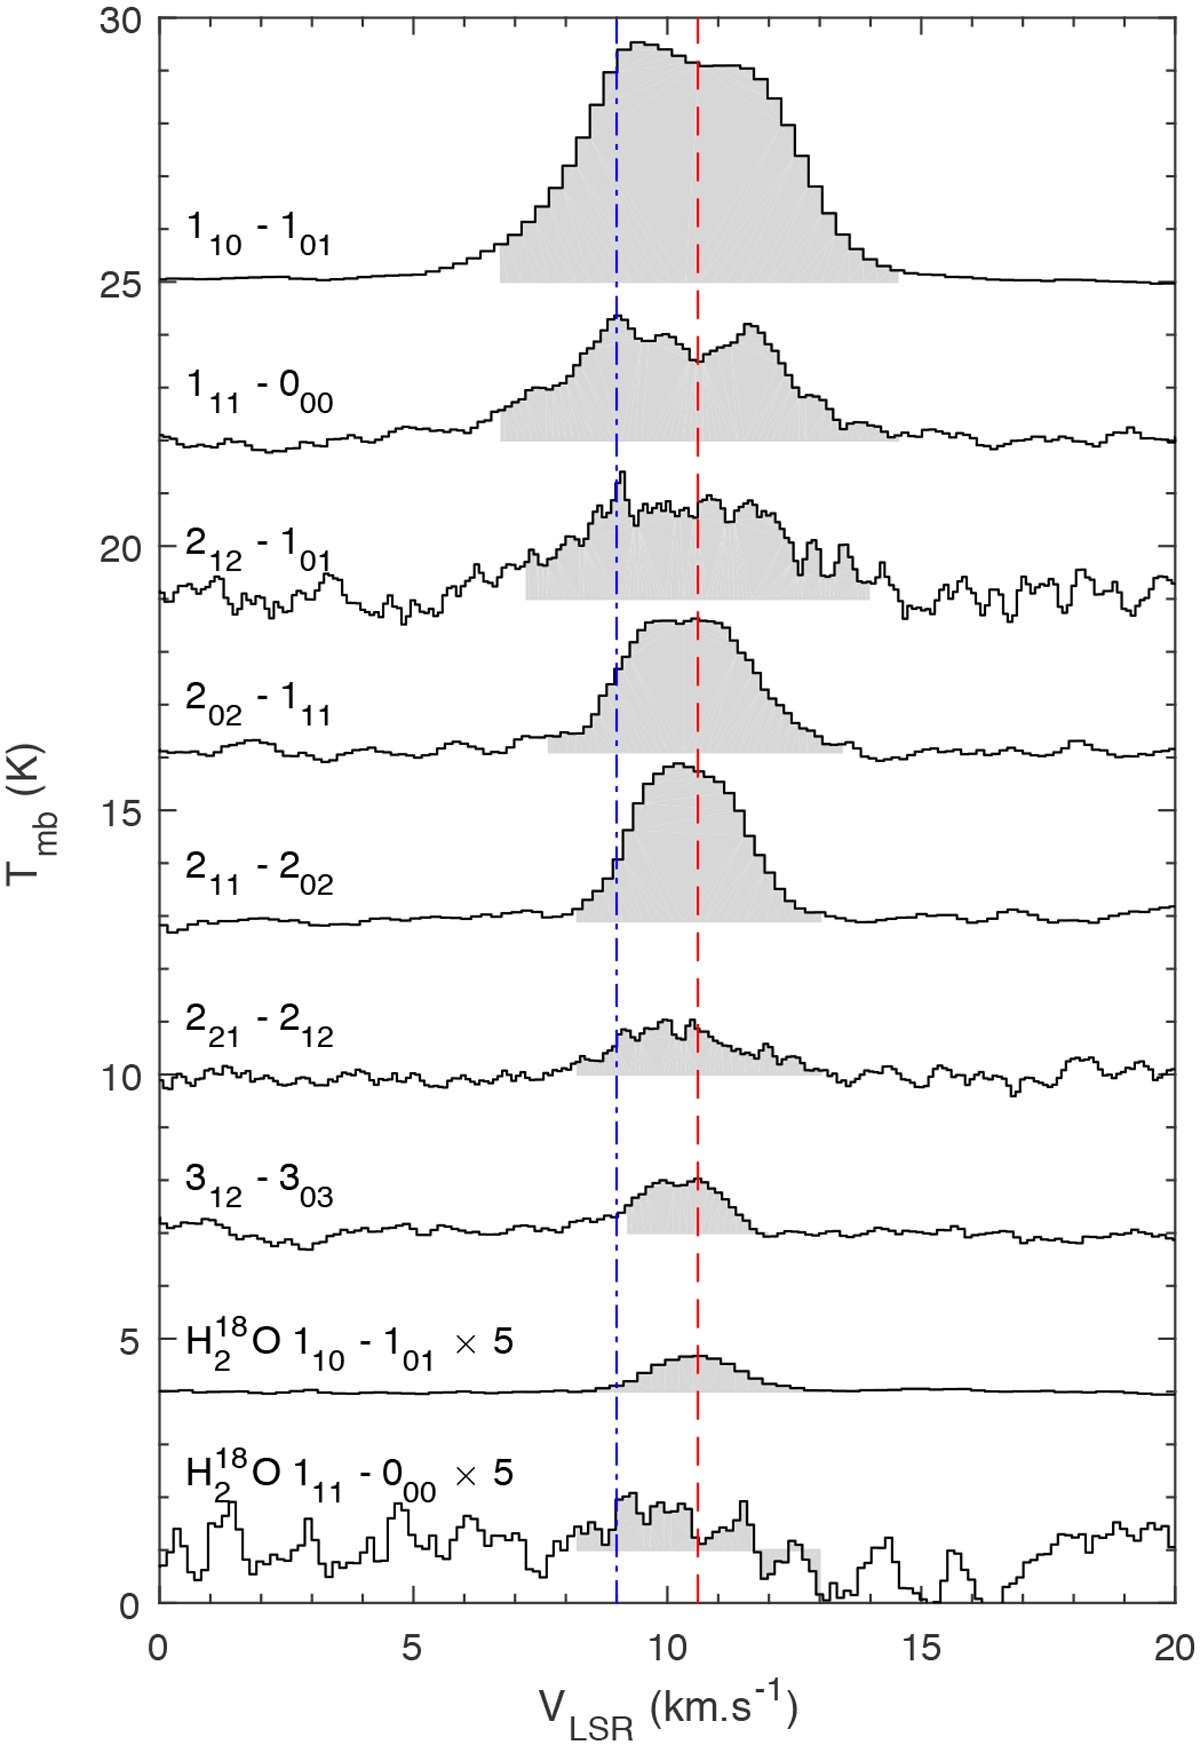
Averaged spectra of ![]() and
and ![]() lines toward the Orion Bar on the main-beam brightness temperature scale, not corrected for the beam coupling factor. The gray areas represent the velocity integration range. The blue dash-dotted line and red dashed line are the expected velocity components from Orion Ridge (9.0 km s−1) and Orion Bar (10.6 km s−1).
lines toward the Orion Bar on the main-beam brightness temperature scale, not corrected for the beam coupling factor. The gray areas represent the velocity integration range. The blue dash-dotted line and red dashed line are the expected velocity components from Orion Ridge (9.0 km s−1) and Orion Bar (10.6 km s−1).
![]() lines were multiplied by a factor of 5.
lines were multiplied by a factor of 5.
Current usage metrics show cumulative count of Article Views (full-text article views including HTML views, PDF and ePub downloads, according to the available data) and Abstracts Views on Vision4Press platform.
Data correspond to usage on the plateform after 2015. The current usage metrics is available 48-96 hours after online publication and is updated daily on week days.
Initial download of the metrics may take a while.