Fig. A.1.
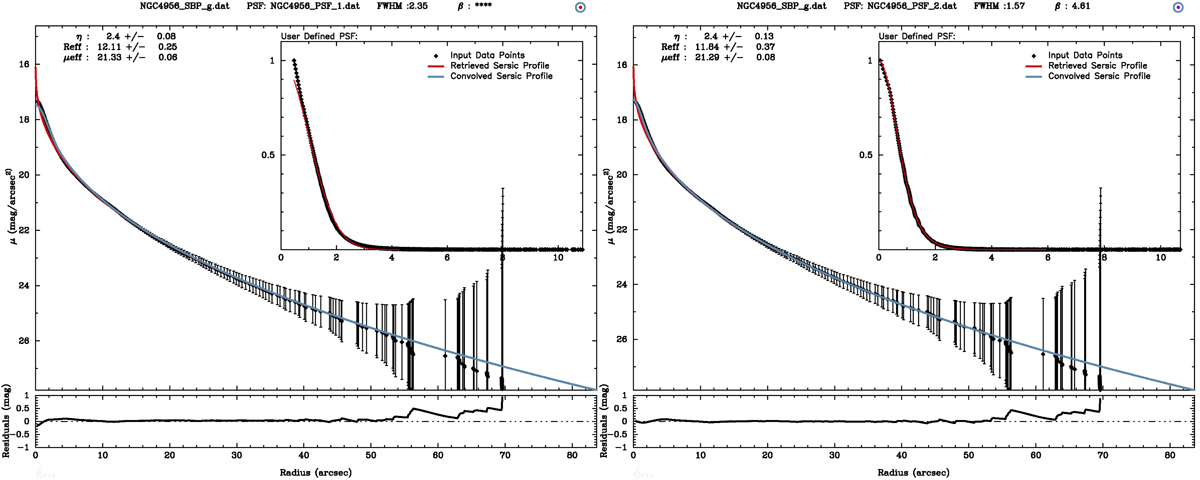
Fitting of the SBP of NGC 4956 with iFIT using two different PSFs. The SBPs (both from the galaxy and individual stars used for the PSF determination) were obtained with the routine FIT/ELL3 in ESO-MIDAS for g-band frames from SDSS DR7. The graphical output from iFIT provides in the header the following information: name of the input file, name of the PSF file, and estimated characteristics for the input PSF (FWHM and βM). The color of the inner dot in the r.h.s. circle informs on the method used to estimate Reff and μeff: blue – non-weighted linear regression; purple – ![]() ; orange – w = 1/σμ; red –
; orange – w = 1/σμ; red – ![]() and that of the circle gives an estimate of the goodness of the fit with blue, purple and red corresponding to an adequate, modest quality and poor fit. Main plot: black dots show the observed SBP and its uncertainties. The red and blue curve shows, respectively, the best-fitting SL model and its convolution with the PSF, and the top-left labels list the estimated η, Reff (″) and μeff (mag/□″). The inset shows the user-defined PSF (i.e., the radial profile of one or several nearby non-saturated field stars) and the fit to it with MINPACK routines. A β = **** indicates that MINPACK failed to correctly fit the PSF, as it can be seen from inspection of the inset in the l.h.s. plot. The bottom panel displays the residuals (in mag) between the observed SBP and the best-fitting SL model of it.
and that of the circle gives an estimate of the goodness of the fit with blue, purple and red corresponding to an adequate, modest quality and poor fit. Main plot: black dots show the observed SBP and its uncertainties. The red and blue curve shows, respectively, the best-fitting SL model and its convolution with the PSF, and the top-left labels list the estimated η, Reff (″) and μeff (mag/□″). The inset shows the user-defined PSF (i.e., the radial profile of one or several nearby non-saturated field stars) and the fit to it with MINPACK routines. A β = **** indicates that MINPACK failed to correctly fit the PSF, as it can be seen from inspection of the inset in the l.h.s. plot. The bottom panel displays the residuals (in mag) between the observed SBP and the best-fitting SL model of it.
Current usage metrics show cumulative count of Article Views (full-text article views including HTML views, PDF and ePub downloads, according to the available data) and Abstracts Views on Vision4Press platform.
Data correspond to usage on the plateform after 2015. The current usage metrics is available 48-96 hours after online publication and is updated daily on week days.
Initial download of the metrics may take a while.