Fig. 8.
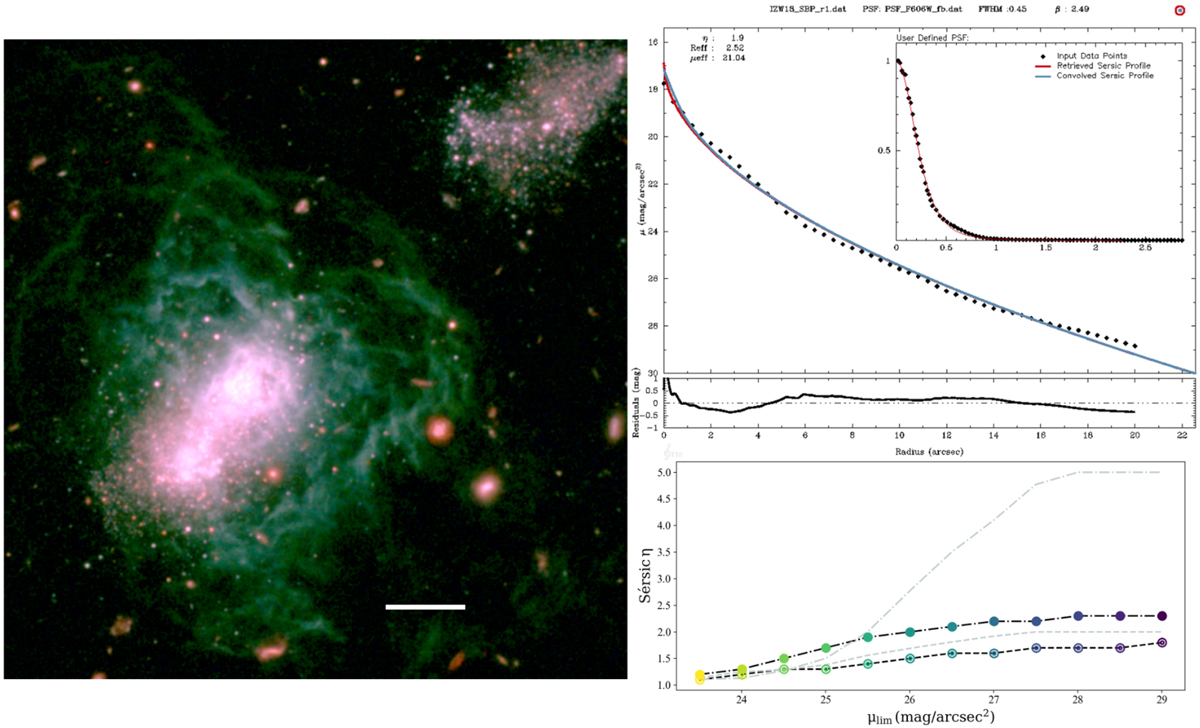
Left panel: true-color image composite of I Zw 18 produced from archival HST data, showing the extended nebular halo of the BCD (adapted from Papaderos & Östlin 2012). The horizontal bar corresponds to 5″. Upper-right panel: SL model with iFIT (blue) to the observed R-band SBP of I Zw 18 (SBP1; from Papaderos & Östlin 2012). The inset shows a Moffat model of the PSF (see appendix for further explanations) and the fit residuals are displayed in the lower diagram. Bottom panel: variation of the best-fitting Sérsic index η vs. limiting surface brightness μlim obtained by Papaderos & Östlin (2012) for SBP1 and SBP2 using standard χ2 minimization (gray dashed and dashed-dotted curve, respectively). Open and filled circles show the result obtained with iFIT by modeling both SBPs down to a μlim between 23.5 mag/□″ and 29 mag/□″.
Current usage metrics show cumulative count of Article Views (full-text article views including HTML views, PDF and ePub downloads, according to the available data) and Abstracts Views on Vision4Press platform.
Data correspond to usage on the plateform after 2015. The current usage metrics is available 48-96 hours after online publication and is updated daily on week days.
Initial download of the metrics may take a while.