Fig. 7.
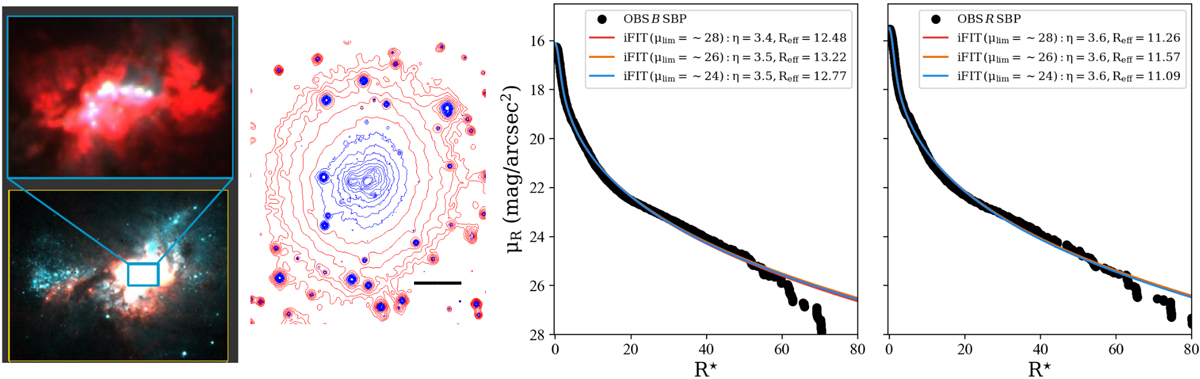
Left panel: true-color image composite of archival broad- and narrow-band HST images for the central region of the BCD Henize 2–10, illustrating the morphological complexity of stellar emission (green and blue) within its starburst component, as well as the presence of strong Hα emission (red) excited by the chain of super-star clusters (zoom-in in the upper panel) discovered by Conti & Vacca (1994). Middle panel: contour map of He 2–10, computed from ground-based data. The morphology of the starburst component and of the underlying older host galaxy is delineated by contours in blue and red, respectively. The horizontal bar corresponds to 20″. Right panel: B- and R-band SBPs of He 2–10, computed with the 2D surface photometry code by Bender & Möllenhoff (1987). The overlaid curves show SL fits with iFIT down to a surface brightness μlim between 24 and 28 mag/□″. It can be seen that in all cases the Sérsic model parameters inferred for both bands are mutually consistent and show little dependence on μlim.
Current usage metrics show cumulative count of Article Views (full-text article views including HTML views, PDF and ePub downloads, according to the available data) and Abstracts Views on Vision4Press platform.
Data correspond to usage on the plateform after 2015. The current usage metrics is available 48-96 hours after online publication and is updated daily on week days.
Initial download of the metrics may take a while.