Fig. 2.
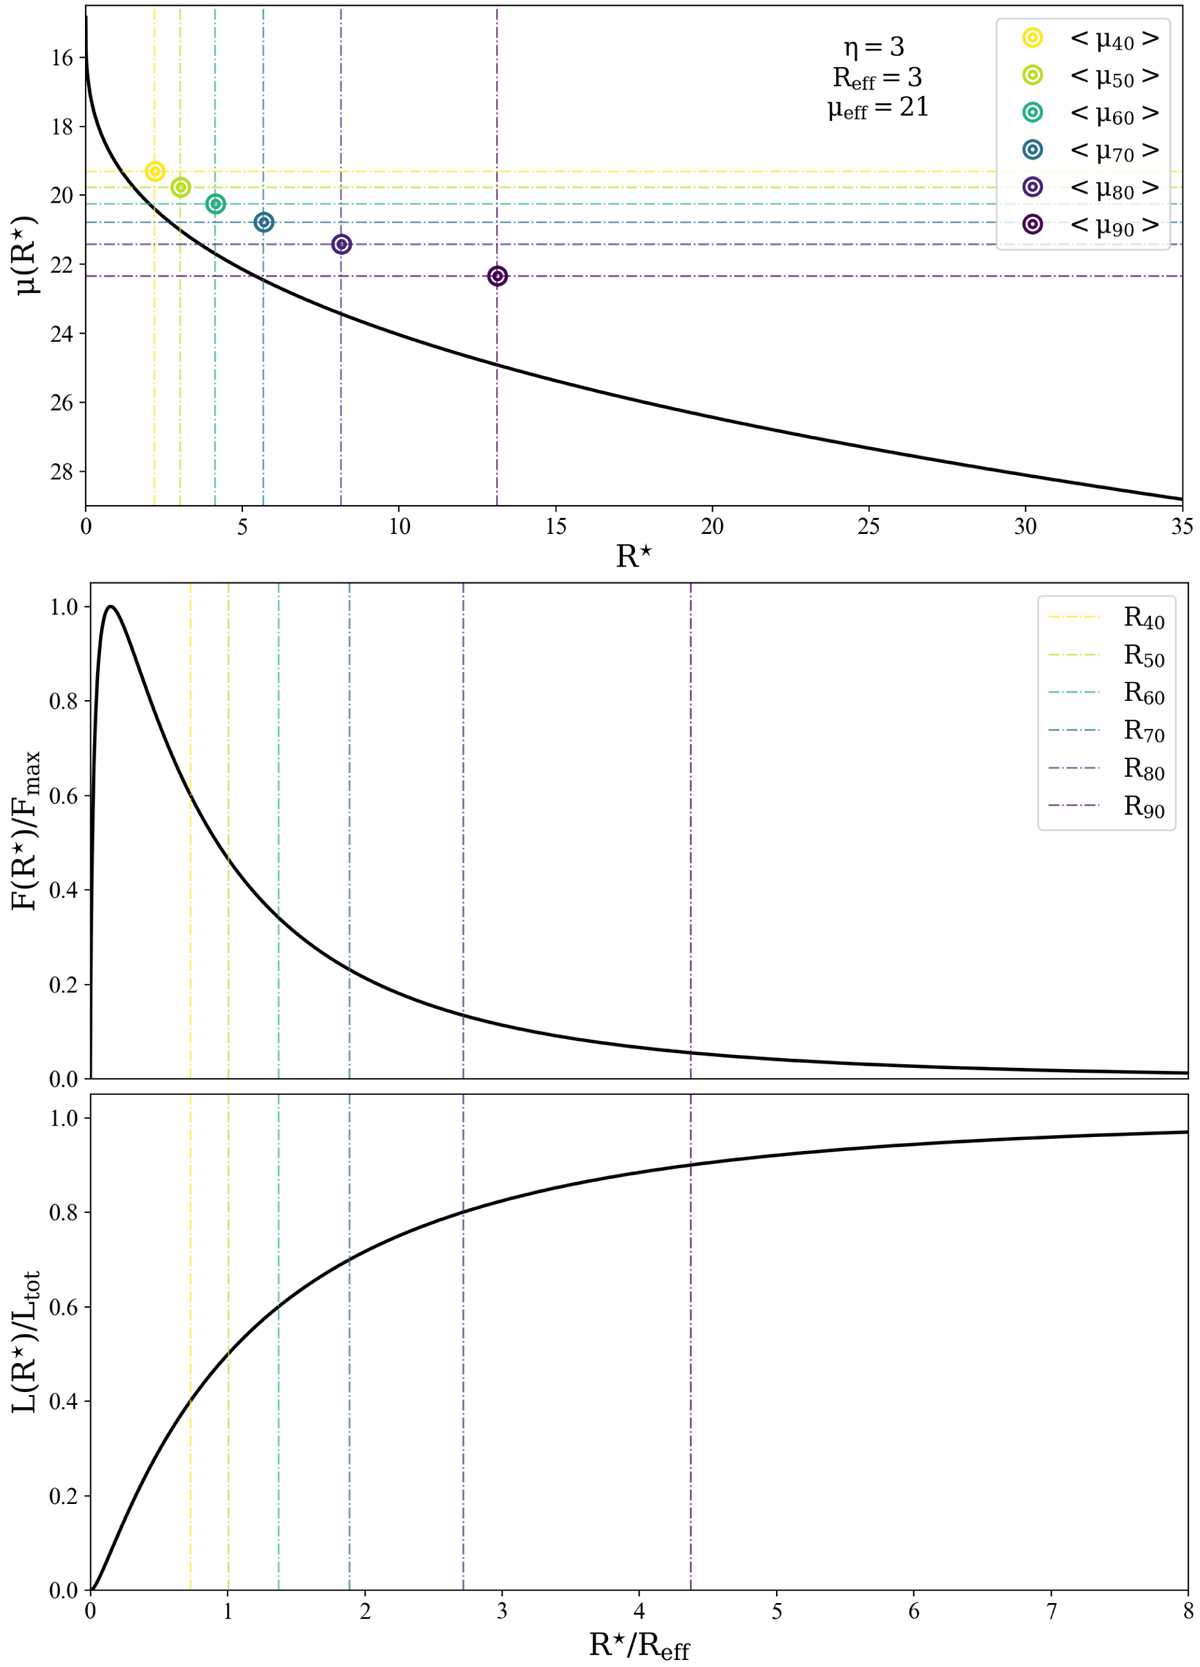
Example a Sérsic profile μ(R⋆) with a η = 3 and an effective radius Reff = 3″ (solid line). Top panel: vertical dashed lines correspond to the radii enclosing 40, 50, 60, 70, 80 and 90% of ![]() , and horizontal lines depict the corresponding mean surface brightness ⟨Ii⟩ therein. Middle panel: contribution to
, and horizontal lines depict the corresponding mean surface brightness ⟨Ii⟩ therein. Middle panel: contribution to ![]() as a function of R⋆ (i.e., integrand in Eq. (3)) normalized to the maximum flux (F(R⋆)/Fmax. Bottom panel: light growth curve L(R⋆)/Ltot of the profile. It can be seen that, although the innermost points (R⋆/Reff ≤ 0.25) show the highest intensity, they are nearly irrelevant in terms of their contribution to the total luminosity.
as a function of R⋆ (i.e., integrand in Eq. (3)) normalized to the maximum flux (F(R⋆)/Fmax. Bottom panel: light growth curve L(R⋆)/Ltot of the profile. It can be seen that, although the innermost points (R⋆/Reff ≤ 0.25) show the highest intensity, they are nearly irrelevant in terms of their contribution to the total luminosity.
Current usage metrics show cumulative count of Article Views (full-text article views including HTML views, PDF and ePub downloads, according to the available data) and Abstracts Views on Vision4Press platform.
Data correspond to usage on the plateform after 2015. The current usage metrics is available 48-96 hours after online publication and is updated daily on week days.
Initial download of the metrics may take a while.