Fig. B.5.
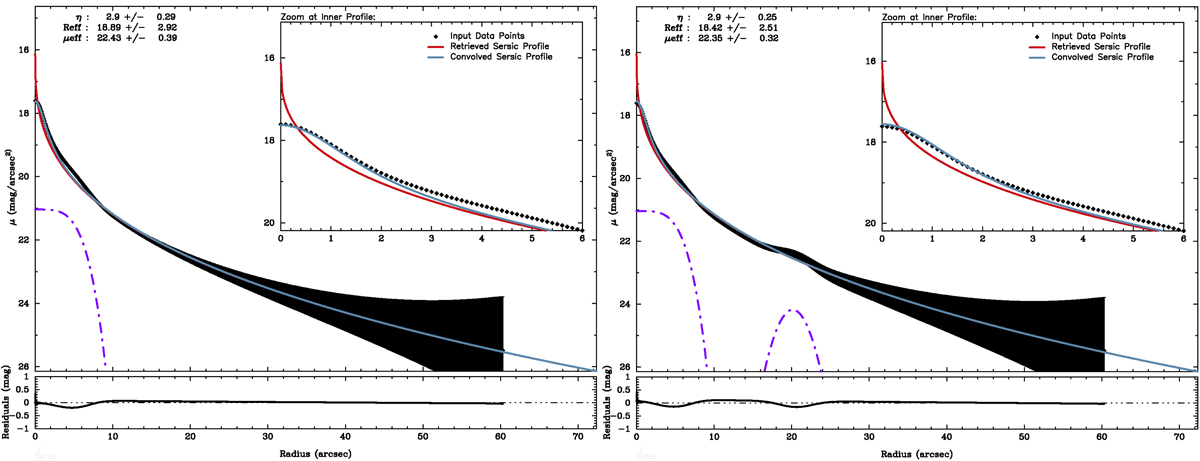
Left panel: theoretical SL profile pB plus an additional component modeled by Eq. (1) with η = 0.25, μ0 = 21.04, α = 6.20 (SL profile pD) and respective iFIT fit. Right panel: pD plus an extra luminosity excess in the faint end of the SL modeled by the polynomial equation μ(R) = 0.148 ⋅ R2 − 5.960 ⋅ R + 84.180, (SL profile pE) with the iFIT solution overplotted. Overplotted dashed-dot purple lines display the additional components.
Current usage metrics show cumulative count of Article Views (full-text article views including HTML views, PDF and ePub downloads, according to the available data) and Abstracts Views on Vision4Press platform.
Data correspond to usage on the plateform after 2015. The current usage metrics is available 48-96 hours after online publication and is updated daily on week days.
Initial download of the metrics may take a while.