Fig. B.1.
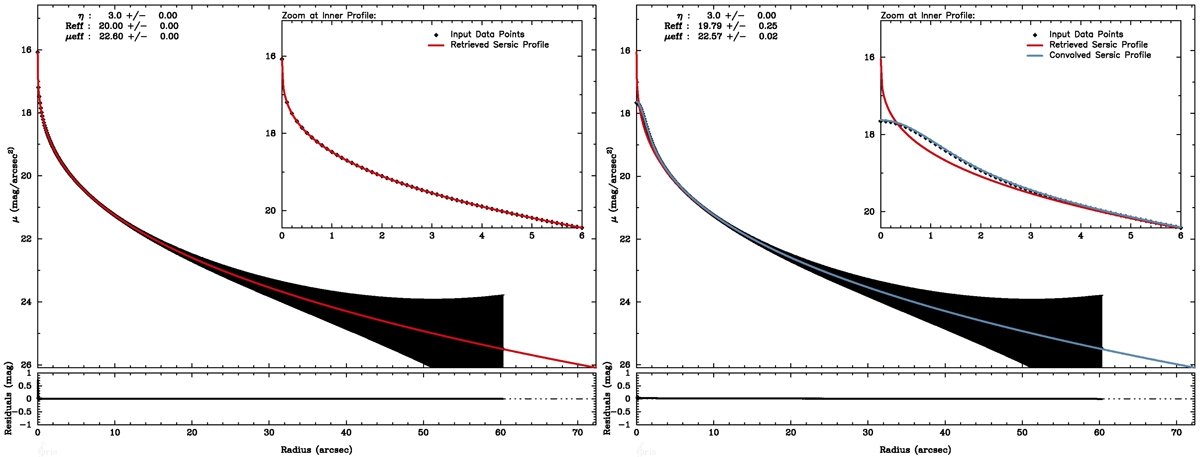
Left panel: theoretical SL profile with η = 3, Reff = 20″, μeff = 22.6 mag (hereafter pA), with σμ estimated following Papaderos et al. (1996a), and its fit (red curve) with iFIT. Right panel: profile pA after convolution with a Moffat PSF with FWHM of 1![]() 57 (hereafter, SL profile pB). The best-fitting SL model and its convolution with the PSF are shown with the red and blue curve, respectively.
57 (hereafter, SL profile pB). The best-fitting SL model and its convolution with the PSF are shown with the red and blue curve, respectively.
Current usage metrics show cumulative count of Article Views (full-text article views including HTML views, PDF and ePub downloads, according to the available data) and Abstracts Views on Vision4Press platform.
Data correspond to usage on the plateform after 2015. The current usage metrics is available 48-96 hours after online publication and is updated daily on week days.
Initial download of the metrics may take a while.