Fig. 8.
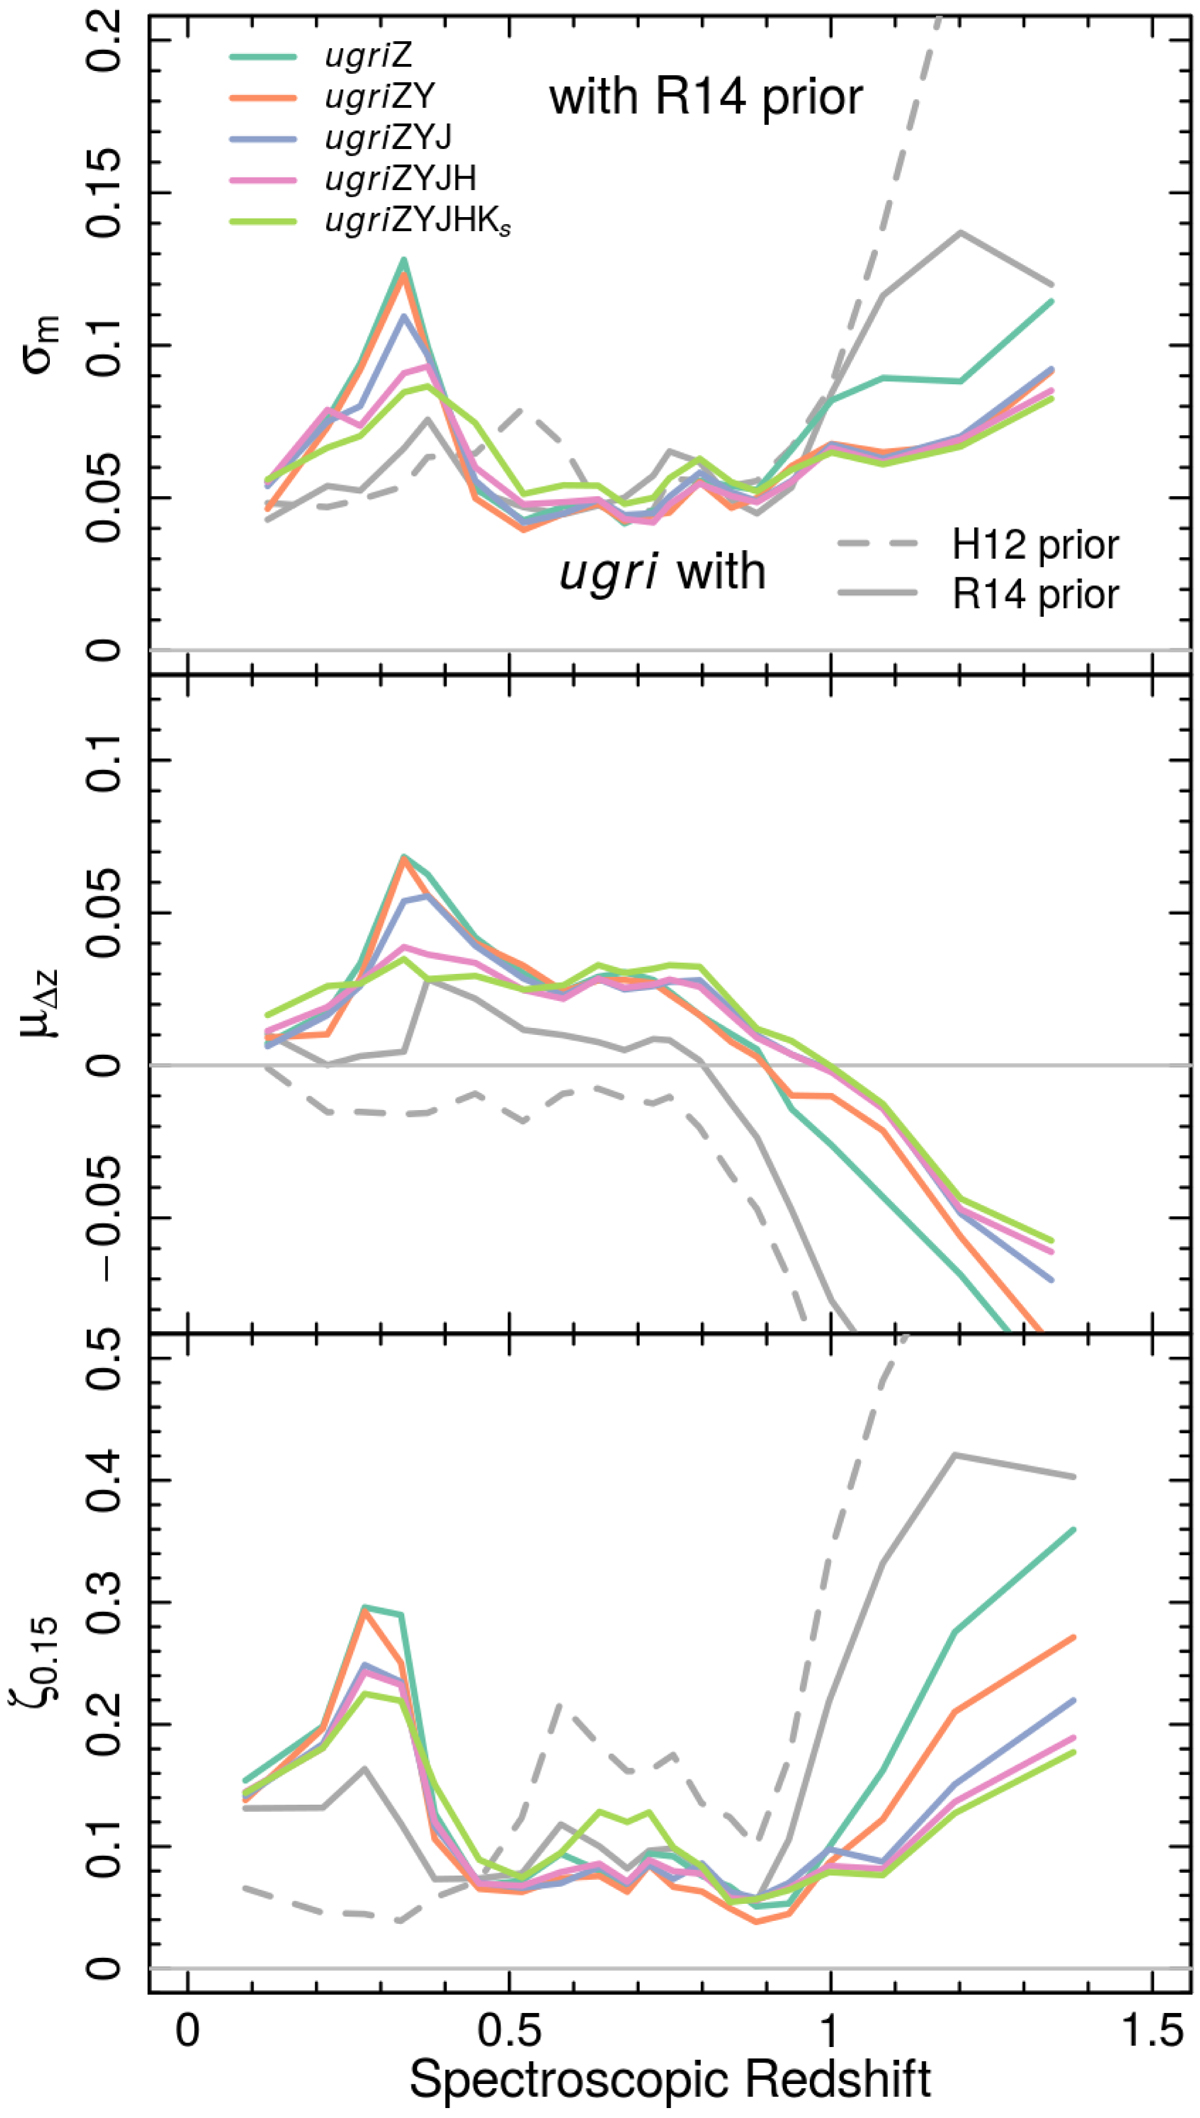
Variation in the photo-z vs. spec-z distribution parameters as a function of spec-z, for the 4-band KiDS-450 dataset with two different priors (grey lines), and as a function of NIR photometric information for the KV450 dataset (coloured lines). The three panels show the spread in the distribution, determined by a running normalised-median-absolute-deviation from the median (σm; top), the median bias in the photo-z distribution (μΔz; middle), and the fraction of sources with |Δz|/(1 + zspec) > 0.15 (ζ0.15; bottom). The addition of the Raichoor et al. (2014) prior to the 4-band data causes significantly better behaviour at low zB, while the addition of NIR data improves the population consistency and scatter in particular at high zB. The same properties as a function of photo-z and magnitude are given in Figs. 9 and 10.
Current usage metrics show cumulative count of Article Views (full-text article views including HTML views, PDF and ePub downloads, according to the available data) and Abstracts Views on Vision4Press platform.
Data correspond to usage on the plateform after 2015. The current usage metrics is available 48-96 hours after online publication and is updated daily on week days.
Initial download of the metrics may take a while.