Fig. 7.
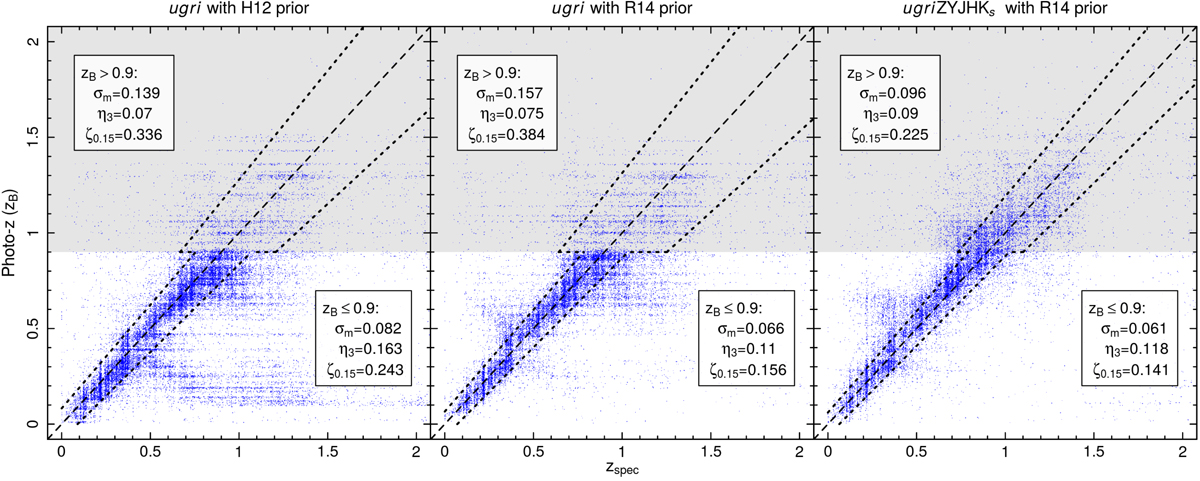
Photometric redshifts (zB) vs. spectroscopic redshifts (zspec) in the deep calibration fields. Left: original KiDS-450 photo-z based on ugri-band photometry. Middle: improved ugri-band photo-z based on the Bayesian prior by Raichoor et al. (2014). Right: KV450 photo-z based on ugriZYJHKs photometry as well as the improved prior. The grey region of the figures indicate sources beyond the zB limit imposed in the KiDS-450 analysis. Annotated in each panel is: the normalised median-absolute-deviation (σm) of the quantity (zB − zspec)/(1 + zspec)≡Δz/(1 + z), the fraction of sources with |Δz/(1 + z)| > 3σm (η3), and the fraction of sources with |Δz/(1 + z)| > 0.15 (ζ0.15). Each of these quantities is calculated individually for the sources above and below zB = 0.9. The value of σm is also displayed graphically in each panel using the black dotted lines. We note the significant improvement in all quantities that is seen when moving from the 4- to 9-band photometry, and in particular that we are now able to constrain zB > 0.9 sources to almost the same accuracy as those zB < 0.9 in the original KiDS-450 dataset.
Current usage metrics show cumulative count of Article Views (full-text article views including HTML views, PDF and ePub downloads, according to the available data) and Abstracts Views on Vision4Press platform.
Data correspond to usage on the plateform after 2015. The current usage metrics is available 48-96 hours after online publication and is updated daily on week days.
Initial download of the metrics may take a while.