Fig. 2.
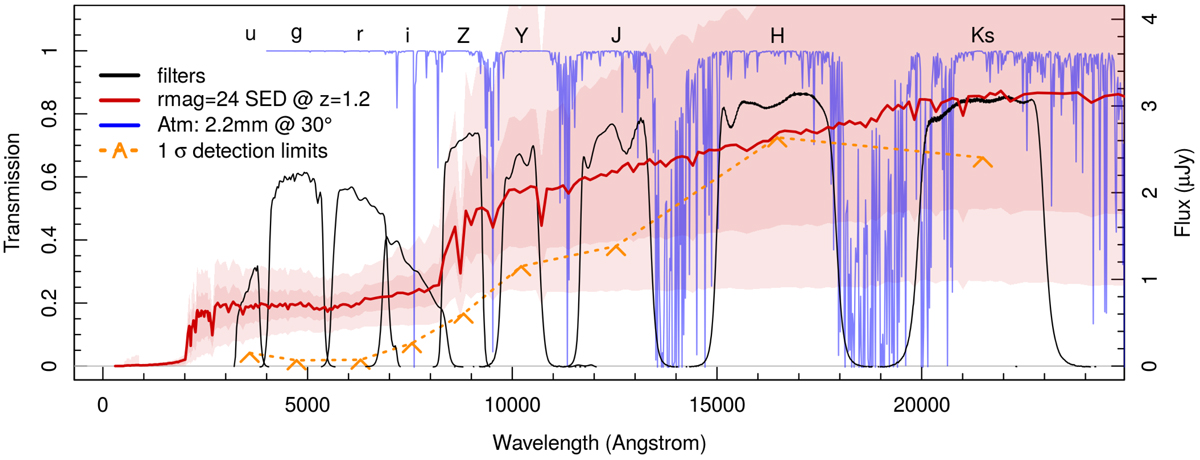
Individual photometric filters (black) that make up the KV450 dataset. Each filter curve is shown as an overall transmission spectrum incorporating mirror, detector, and filter effects. We also show the typical transmission spectrum of the atmosphere at Paranal (blue) for modest values of precipitable water vapour (2.2 mm) and zenith angle (30°). In addition, we also show the median LE PHARE spectrum of all KV450 galaxies with photometric redshift ZB = 1.2 and magnitude r ∼ 24 (red). The 68th and 99th percentiles of these models are also shown as shaded red regions. The 1σ detection limits of each band (orange chevrons and dotted line, derived from the values in Table 1) are also shown, for reference. These model spectra demonstrate the complementarity of the KiDS & VIKING surveys; a typical galaxy at the furthest and faintest end of our analysis is still detected in all bands. It also demonstrates the main benefit of having NIR imaging within this dataset, in that it allows much more accurate constraint of photometric redshifts for (4000 Å) Balmer-break galaxies at redshifts z ≳ 1.
Current usage metrics show cumulative count of Article Views (full-text article views including HTML views, PDF and ePub downloads, according to the available data) and Abstracts Views on Vision4Press platform.
Data correspond to usage on the plateform after 2015. The current usage metrics is available 48-96 hours after online publication and is updated daily on week days.
Initial download of the metrics may take a while.