Fig. 14.
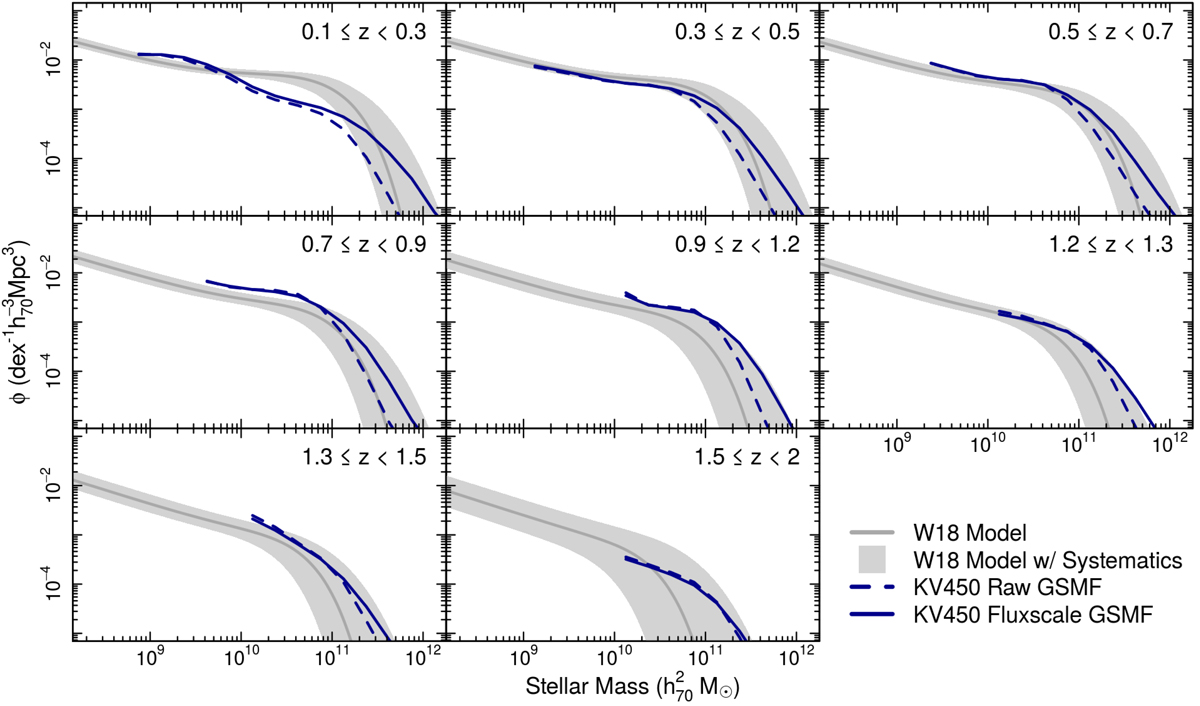
Galaxy stellar mass functions for the KV450 dataset, shown with (blue, solid) and without (blue, dashed) the fluxscale factor incorporated, compared to the mass function model given in Wright et al. (2018) (dark grey). KV450 lines are shown only over the range where we believe the mass function to be volume complete. To ensure a fair comparison, we also show the model mass function when allowing for uncertainty in photometric redshift (|Δz|≤0.02) and Eddington bias (|ΔM⋆|≤0.2) in grey. The KV450 mass function shows a significant deviation from the expectation in the lowest redshift bin, which we attribute to a bias against selecting the largest-angular-size galaxies in our analysis (see Sect. 5). In all other bins the agreement with the model is exceptional given the simplicity of the analysis performed, and inspires considerable confidence in the fidelity of our mass estimates.
Current usage metrics show cumulative count of Article Views (full-text article views including HTML views, PDF and ePub downloads, according to the available data) and Abstracts Views on Vision4Press platform.
Data correspond to usage on the plateform after 2015. The current usage metrics is available 48-96 hours after online publication and is updated daily on week days.
Initial download of the metrics may take a while.