Fig. 13.
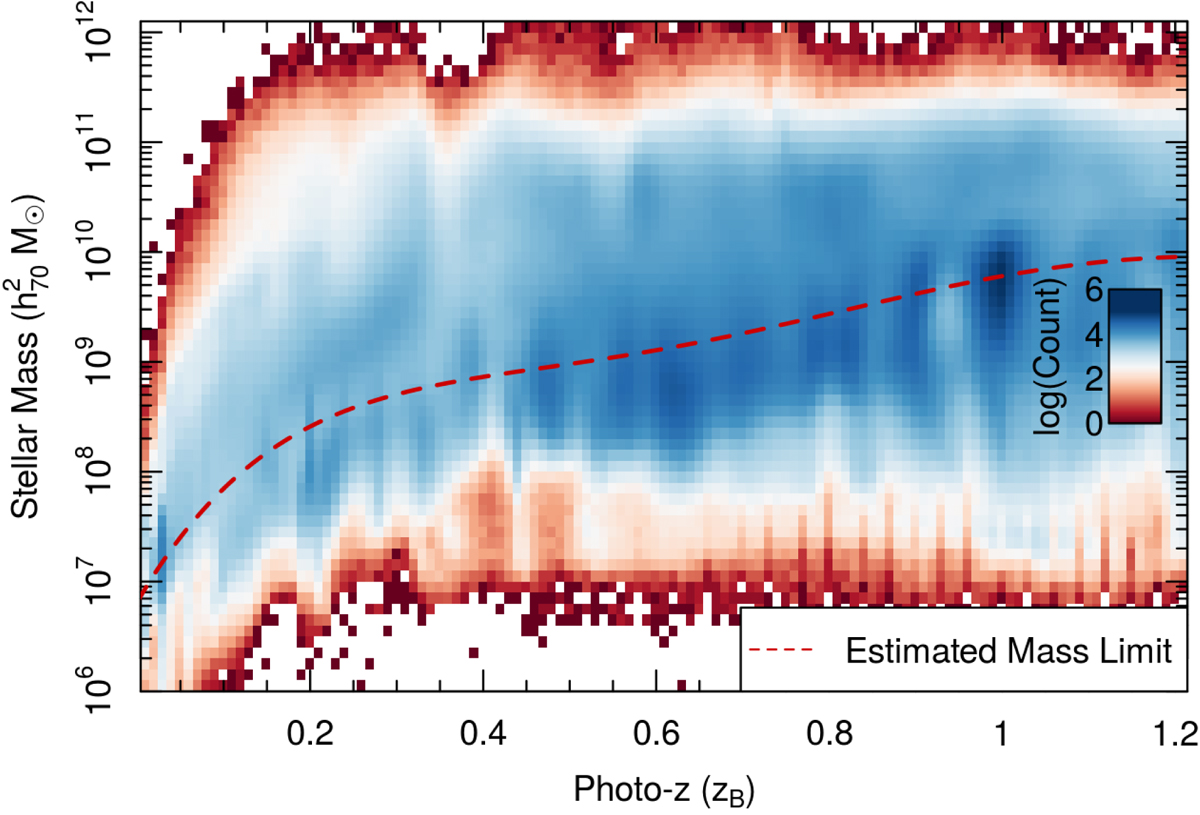
Distribution of all KV450 galaxy stellar mass estimates as a function of photo-z. The data is shown as a 2D-histogram with logarithmic scaling. The distribution is fairly consistent with what is expected of a magnitude limited galaxy sample, although the incompleteness at low-z is worth noting. The distribution is fairly uniform above the mass limits (red dashed line). Below the limits we see signs of systematic incompleteness and redshift focussing (caused by the typically noisier data there).
Current usage metrics show cumulative count of Article Views (full-text article views including HTML views, PDF and ePub downloads, according to the available data) and Abstracts Views on Vision4Press platform.
Data correspond to usage on the plateform after 2015. The current usage metrics is available 48-96 hours after online publication and is updated daily on week days.
Initial download of the metrics may take a while.