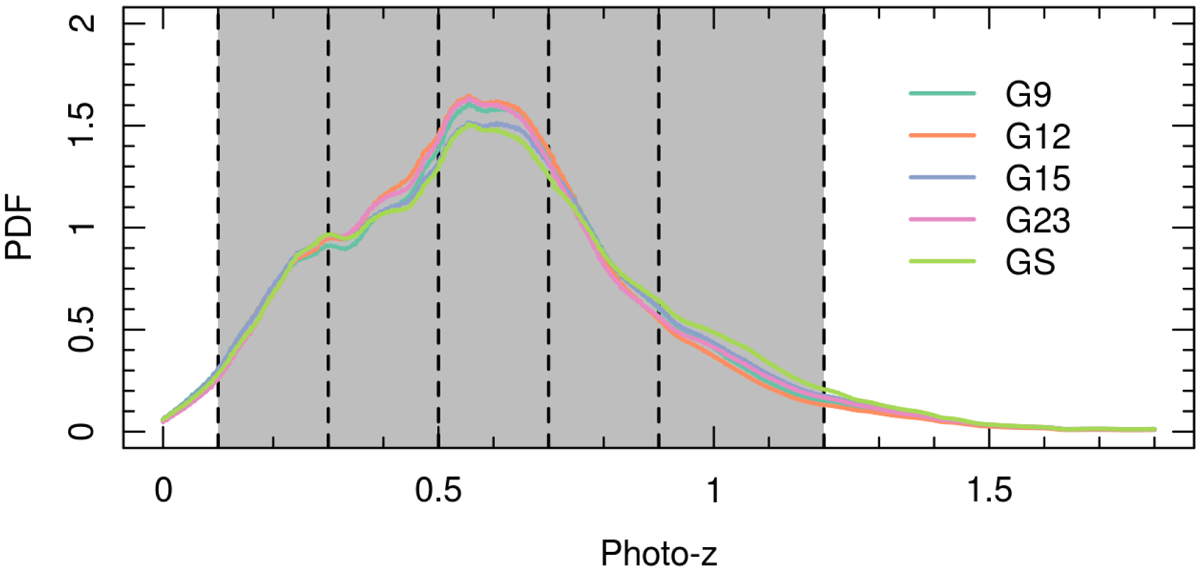
Fig. 11.

Distributions of photo-z within each of our five survey fields (shown in Fig. 1). The figure shows the PDF estimated using a width = 0.1 top-hat kernel for each of the five fields (coloured lines). The tomographic bins used in KiDS are shown by the grey shading and black dashed lines. Sources plotted here are those within the KV450 lensing selection (Fig. 6) and with an additional r ≤ 23.5 magnitude selection, to remove the effect of variable depth on the comparison. The figure demonstrates that, in a like-for-like comparison between the fields, the KV450 photo-z are homogeneous.
Current usage metrics show cumulative count of Article Views (full-text article views including HTML views, PDF and ePub downloads, according to the available data) and Abstracts Views on Vision4Press platform.
Data correspond to usage on the plateform after 2015. The current usage metrics is available 48-96 hours after online publication and is updated daily on week days.
Initial download of the metrics may take a while.


