Fig. 9.
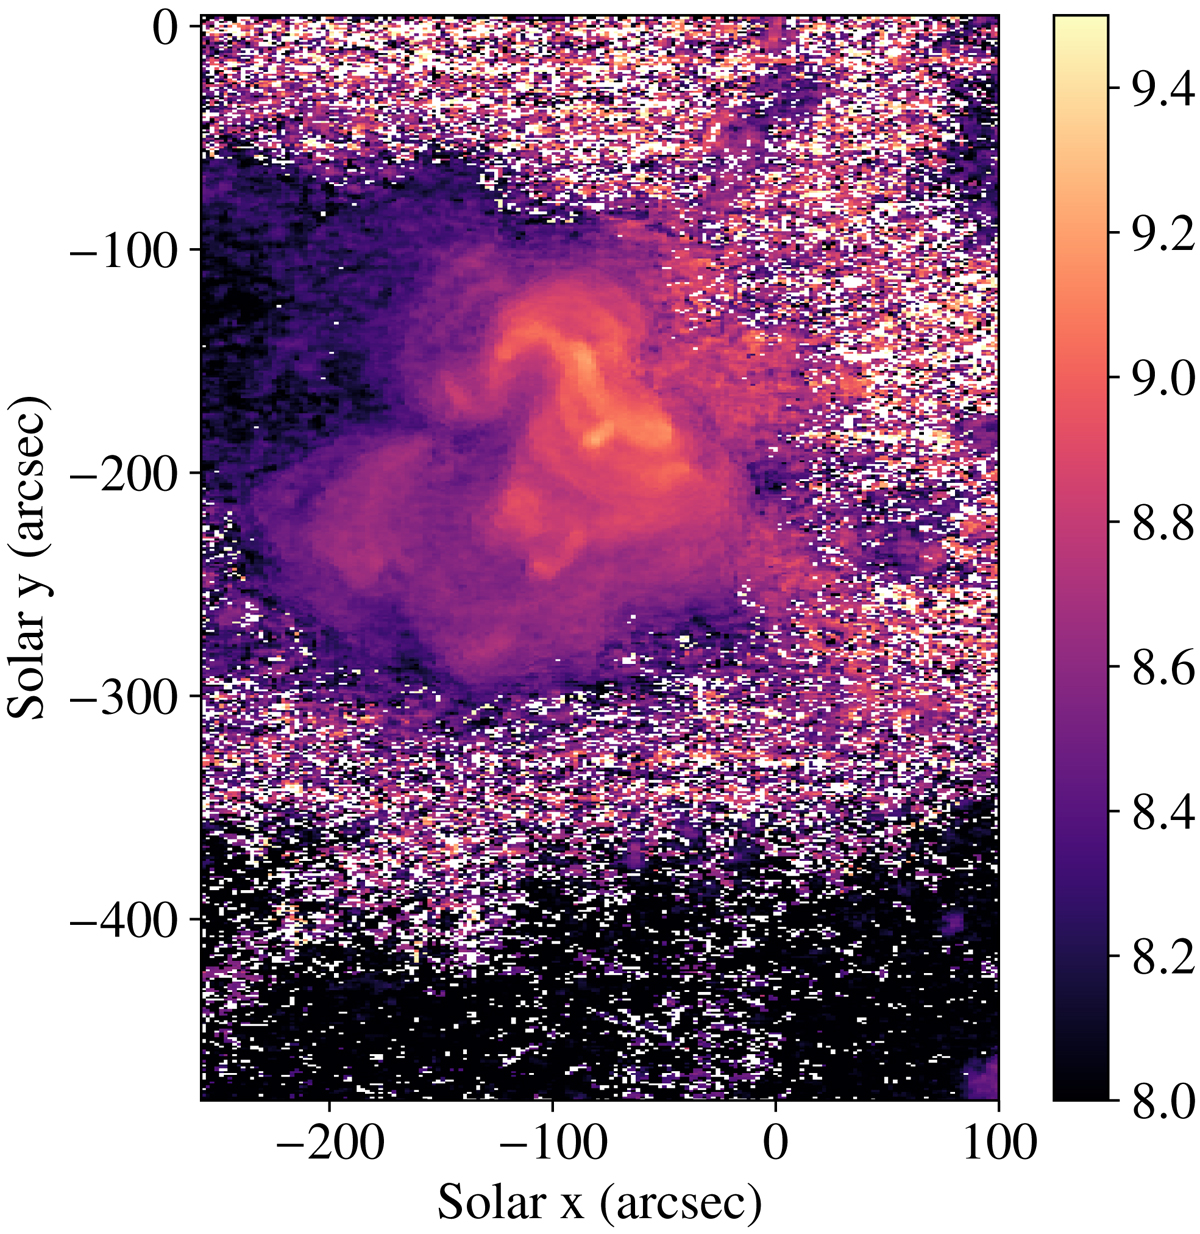
Map of the logarithm of the density in cm−3 obtained for the observation on October 17, 2007, from EIS spectra. We used the Fe XIII λ 202.02 and 203.83 line pair to calculate this density map. In the white pixels, fitting of the EIS lines failed. The density value of each pixel allows us to compute the optimal linear combination of lines to be used to determine the FIP bias in those pixels.
Current usage metrics show cumulative count of Article Views (full-text article views including HTML views, PDF and ePub downloads, according to the available data) and Abstracts Views on Vision4Press platform.
Data correspond to usage on the plateform after 2015. The current usage metrics is available 48-96 hours after online publication and is updated daily on week days.
Initial download of the metrics may take a while.