Fig. 5.
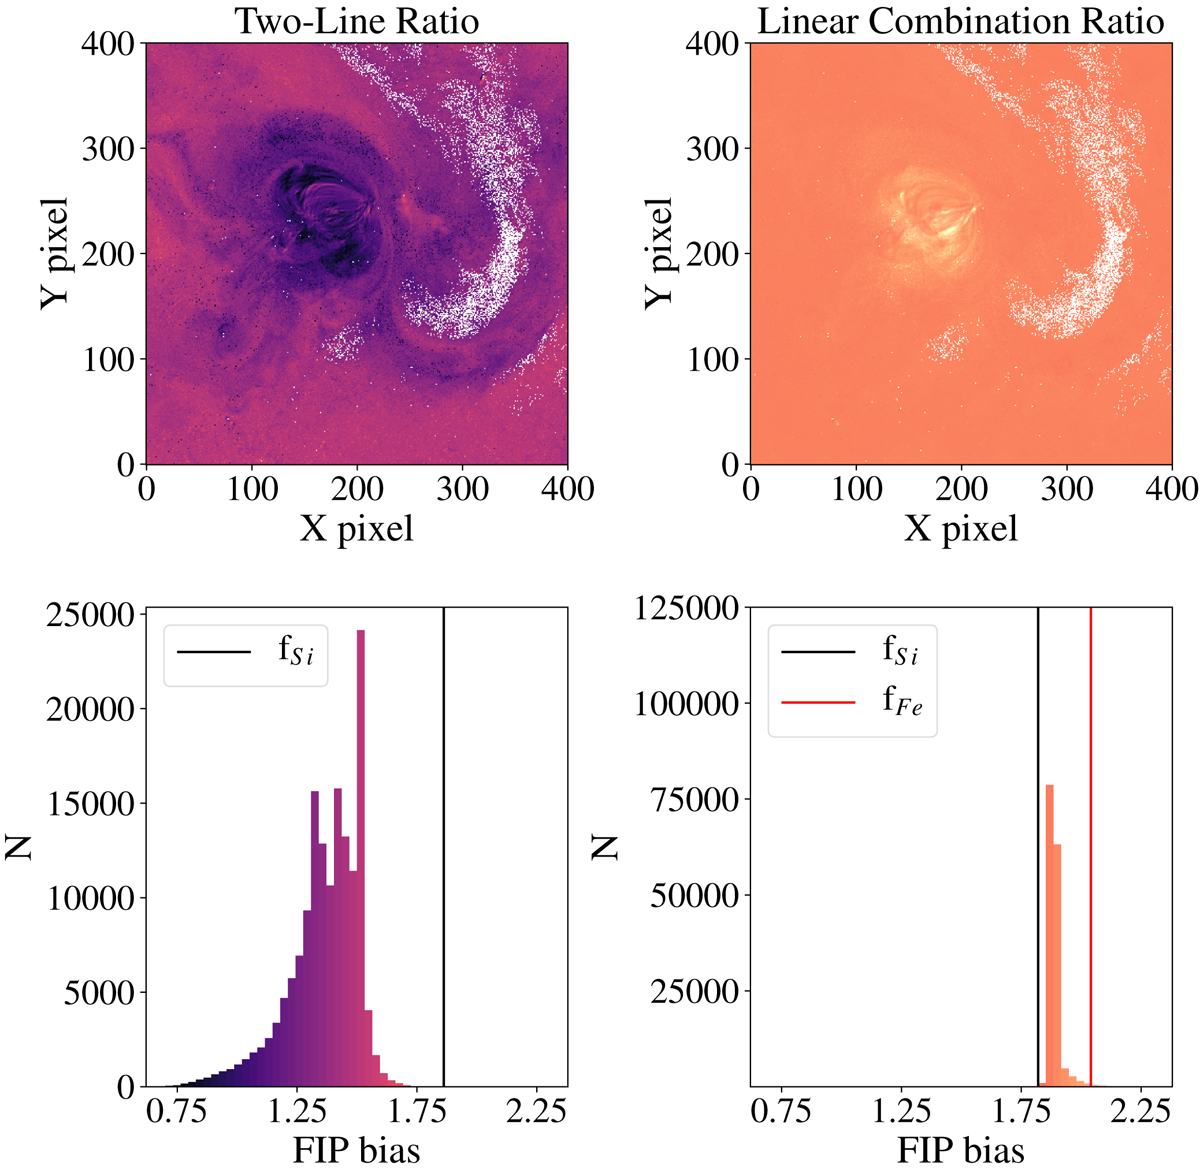
Results of FIP bias determination using the 2LR (left) and LCR (right) methods on the synthetic radiances in the first region of interest (black square) of Fig. 1: relative FIP maps (top) and their corresponding histograms (bottom), with matching colour scales. The DEM inversion code was not able to find a satisfactory solution in the pixels depicted in white. The vertical lines in the histograms correspond to the imposed uniform values of the relative FIP bias (for each of the low-FIP elements; see Table 2) that should ideally be retrieved.
Current usage metrics show cumulative count of Article Views (full-text article views including HTML views, PDF and ePub downloads, according to the available data) and Abstracts Views on Vision4Press platform.
Data correspond to usage on the plateform after 2015. The current usage metrics is available 48-96 hours after online publication and is updated daily on week days.
Initial download of the metrics may take a while.