Fig. B.3.
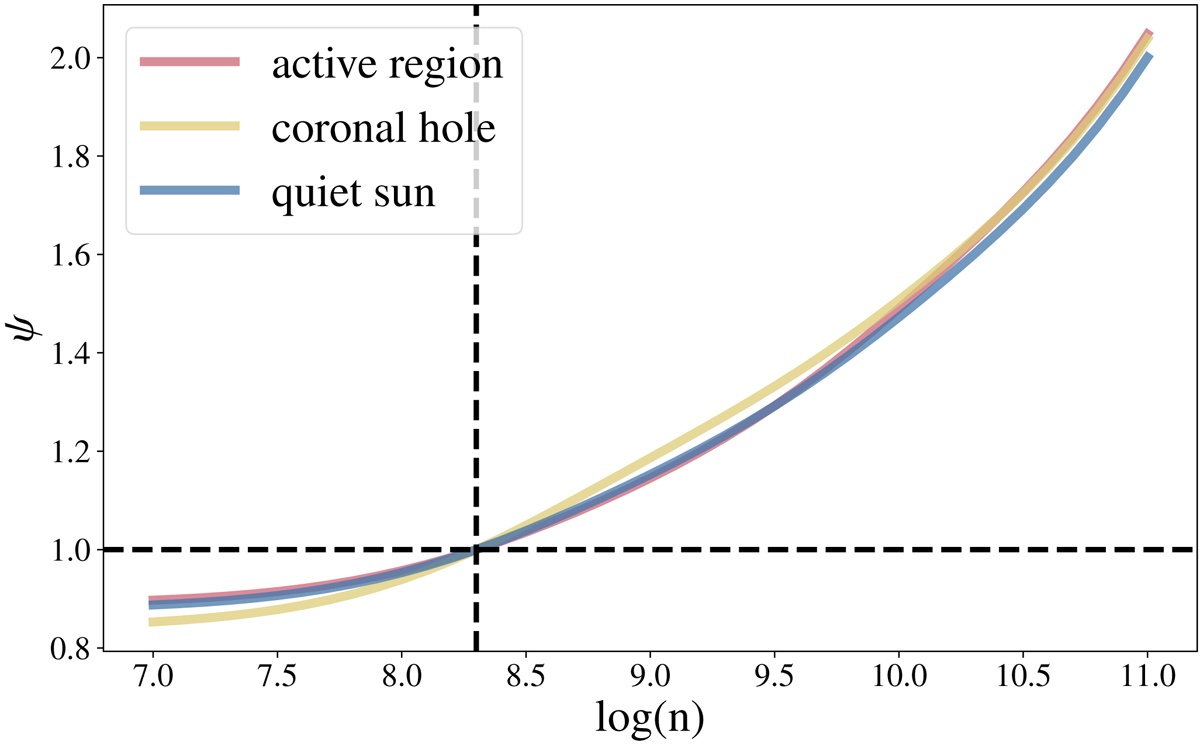
Value of ψ from Eq. (22) as a function of density for each typical EM from CHIANTI for the linear combinations of lines used in the LCR method. This time we use the coefficients listed in Table 1 computed at a fixed density of log n = 8.3 and the contribution functions are evaluated at the different density values. The dashed lines correspond to the density value assumed for the optimisation, and to the target value of ψ.
Current usage metrics show cumulative count of Article Views (full-text article views including HTML views, PDF and ePub downloads, according to the available data) and Abstracts Views on Vision4Press platform.
Data correspond to usage on the plateform after 2015. The current usage metrics is available 48-96 hours after online publication and is updated daily on week days.
Initial download of the metrics may take a while.