Fig. 10.
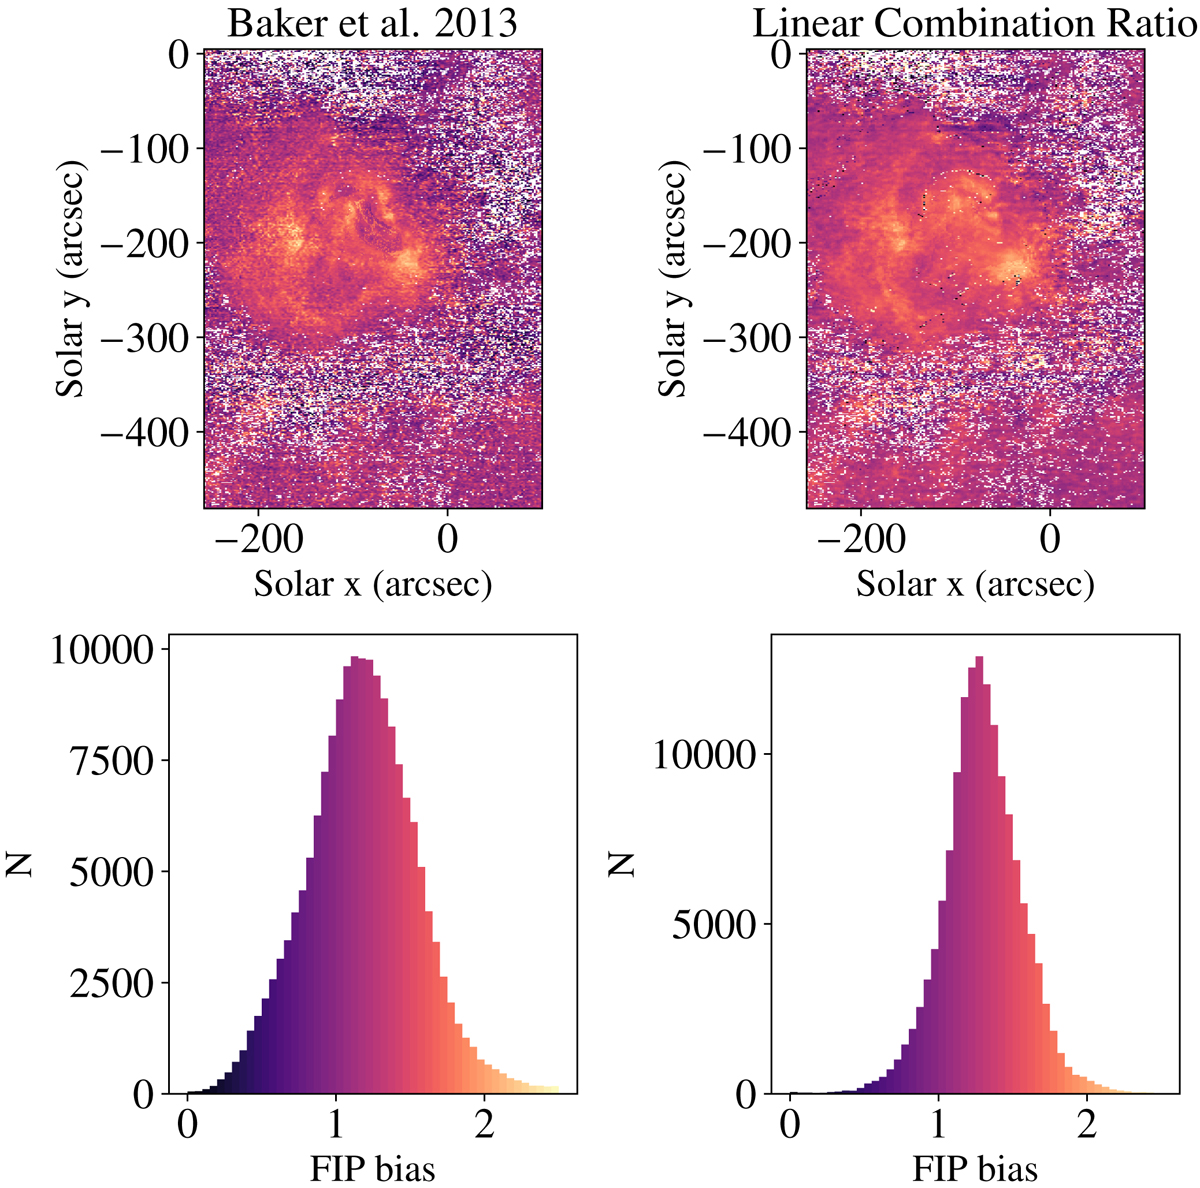
First ionization potential bias maps obtained with different methods and the corresponding histograms. Left panel: FIP bias map obtained following DEM inversion (adapted from Baker et al. 2013). Right panel: FIP bias map obtained using the LCR method. In the white pixels, the fitting of the EIS lines we performed failed. In both FIP bias maps we only plot the pixels where our fitting was successful.
Current usage metrics show cumulative count of Article Views (full-text article views including HTML views, PDF and ePub downloads, according to the available data) and Abstracts Views on Vision4Press platform.
Data correspond to usage on the plateform after 2015. The current usage metrics is available 48-96 hours after online publication and is updated daily on week days.
Initial download of the metrics may take a while.