Fig. 1.
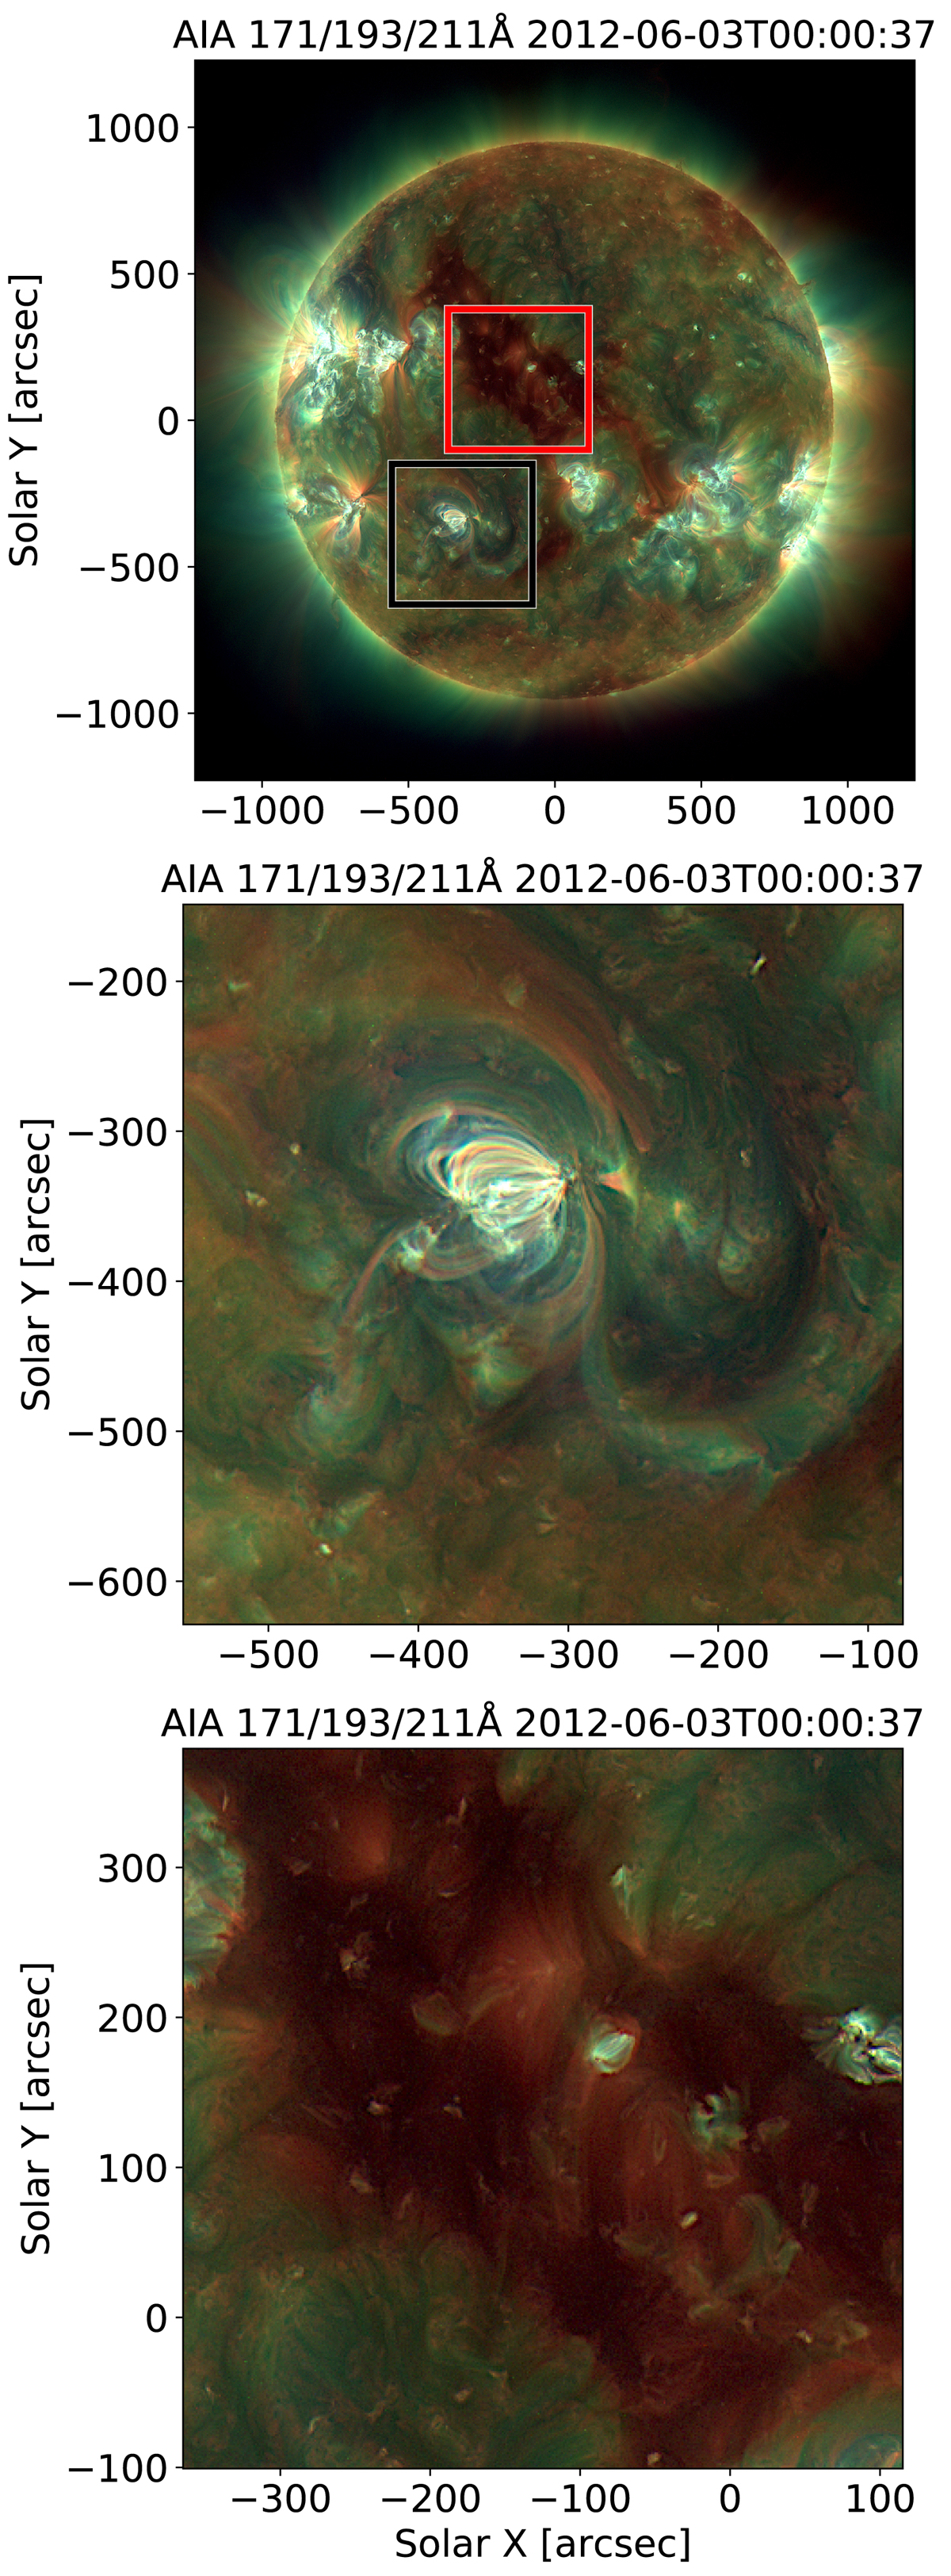
Top panel: composite map of the solar corona on June 3, 2012, in the 171 Å (red), 193 Å (green), and 211 Å (blue) channels of the AIA instrument aboard SDO. The black and red squares correspond to the regions of interest used for testing the method, and are centred on an AR and a CH, respectively. Middle panel: zoom on the AR region of interest (black square in top panel). Bottom panel: zoom on the CH region of interest (red square in top panel).
Current usage metrics show cumulative count of Article Views (full-text article views including HTML views, PDF and ePub downloads, according to the available data) and Abstracts Views on Vision4Press platform.
Data correspond to usage on the plateform after 2015. The current usage metrics is available 48-96 hours after online publication and is updated daily on week days.
Initial download of the metrics may take a while.