Fig. 6
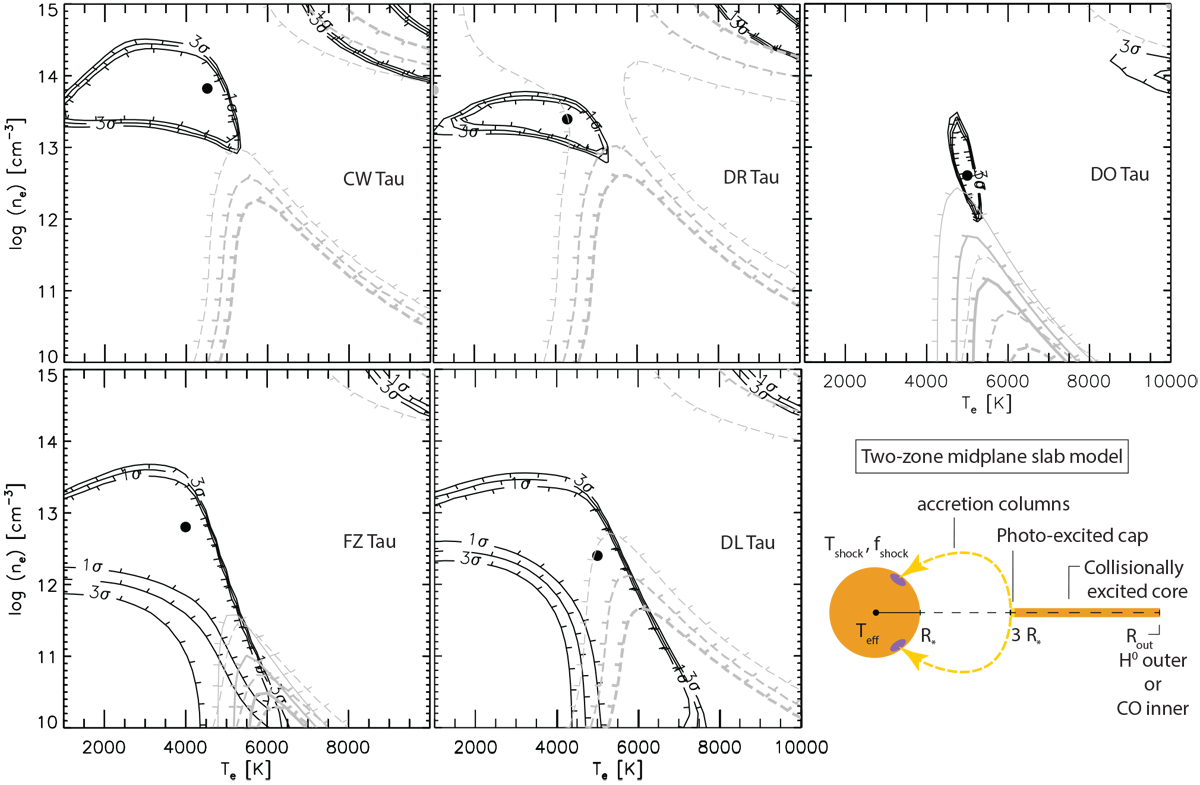
Grids of ne and Te for the C0 line ratios of each of the five stars. Black contours are the 1, 2, and 3σ confidence intervals on the best-fitting combination of ne and Te for the detected emission lines, given by the black dot. Gray contours are the 1, 2, and 3σ confidence intervals on the non-detected lines at 0.985 and 1.055 μm. The non-detections preclude the high density, high temperature solutions to the detected line fits seen in, e.g., CW Tau. The bottom right panel is a representative cartoon of the slab model, with the photoexcited cap and optically thick, collisionally excited core.
Current usage metrics show cumulative count of Article Views (full-text article views including HTML views, PDF and ePub downloads, according to the available data) and Abstracts Views on Vision4Press platform.
Data correspond to usage on the plateform after 2015. The current usage metrics is available 48-96 hours after online publication and is updated daily on week days.
Initial download of the metrics may take a while.