Fig. 5
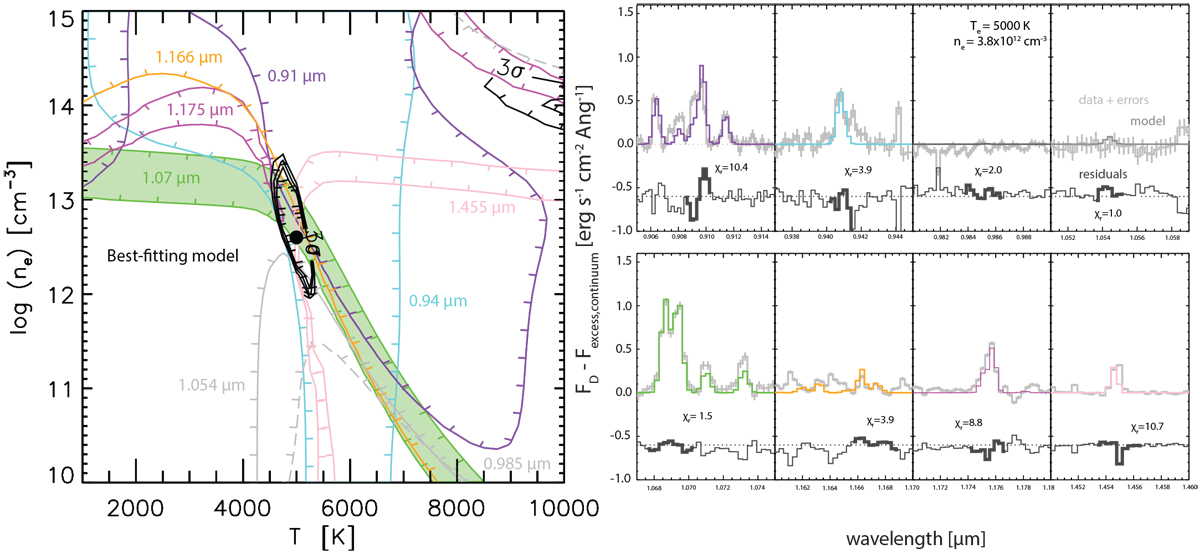
Left: electron temperatures and densities that fit the ratios between the 1.069 μm line and all other lines at a 1σ level (colored contours, wavelengths labeled). The lines are color coded to match the spectra in the right panel. The green fill in between the green contours is an example of how to read the contour plot; the filled region covers the best-fitting set of ne and Te for the 1.07 μm line ratio. Other contours are not filled, but the tickmarks point downhill. The gray contour indicates where the non-detection at 1.0544 μm is matched. The black contours are the 1, 2, and 3σ confidence intervals on the best-fit to the combined lines. Right: continuum subtracted spectra of the six main C0 transition clusters and the non-detections at 0.985 and 1.0544 μm, normalized to the flux at 1.0694 μm, in DO Tau. Model fits for Te = 5750 K and ne = 6.3 × 1012 cm−3 are overplotted. The spectra are color-coded to match the 1σ line ratios regions in the left panel.
Current usage metrics show cumulative count of Article Views (full-text article views including HTML views, PDF and ePub downloads, according to the available data) and Abstracts Views on Vision4Press platform.
Data correspond to usage on the plateform after 2015. The current usage metrics is available 48-96 hours after online publication and is updated daily on week days.
Initial download of the metrics may take a while.