Free Access
Fig. 4
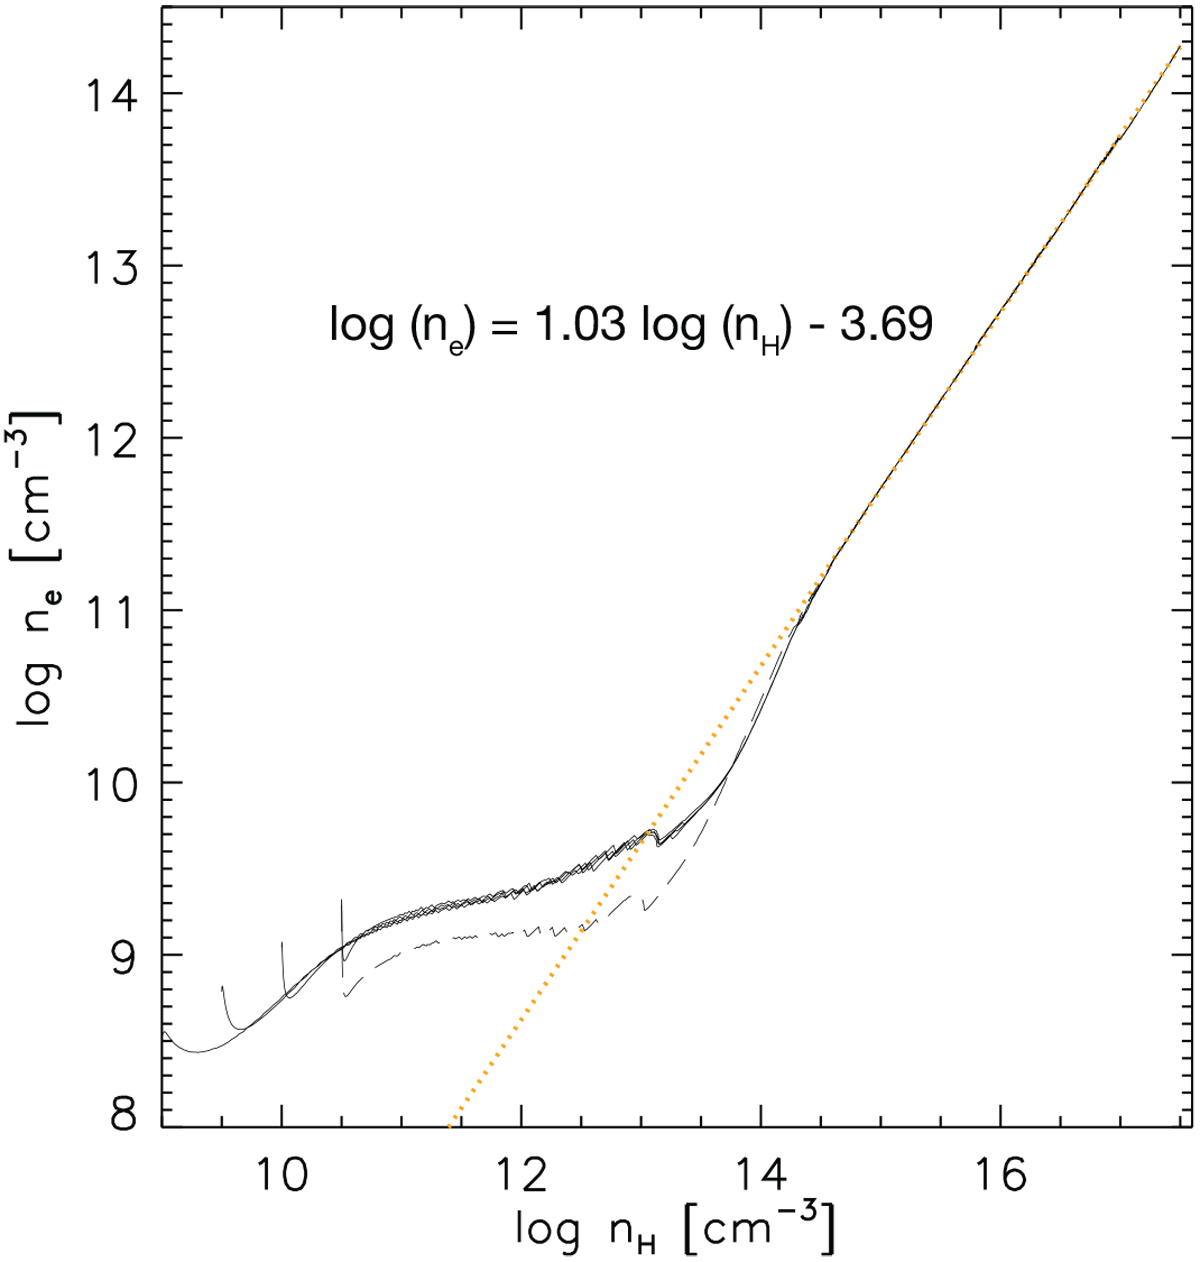
Electron density versus hydrogen density for vertical slab models of stars in my sample. The orange dotted line represents the power law fit to the region with log nH > 14.5, and labeled equations gives the functional form of this fit.
Current usage metrics show cumulative count of Article Views (full-text article views including HTML views, PDF and ePub downloads, according to the available data) and Abstracts Views on Vision4Press platform.
Data correspond to usage on the plateform after 2015. The current usage metrics is available 48-96 hours after online publication and is updated daily on week days.
Initial download of the metrics may take a while.