Fig. 2
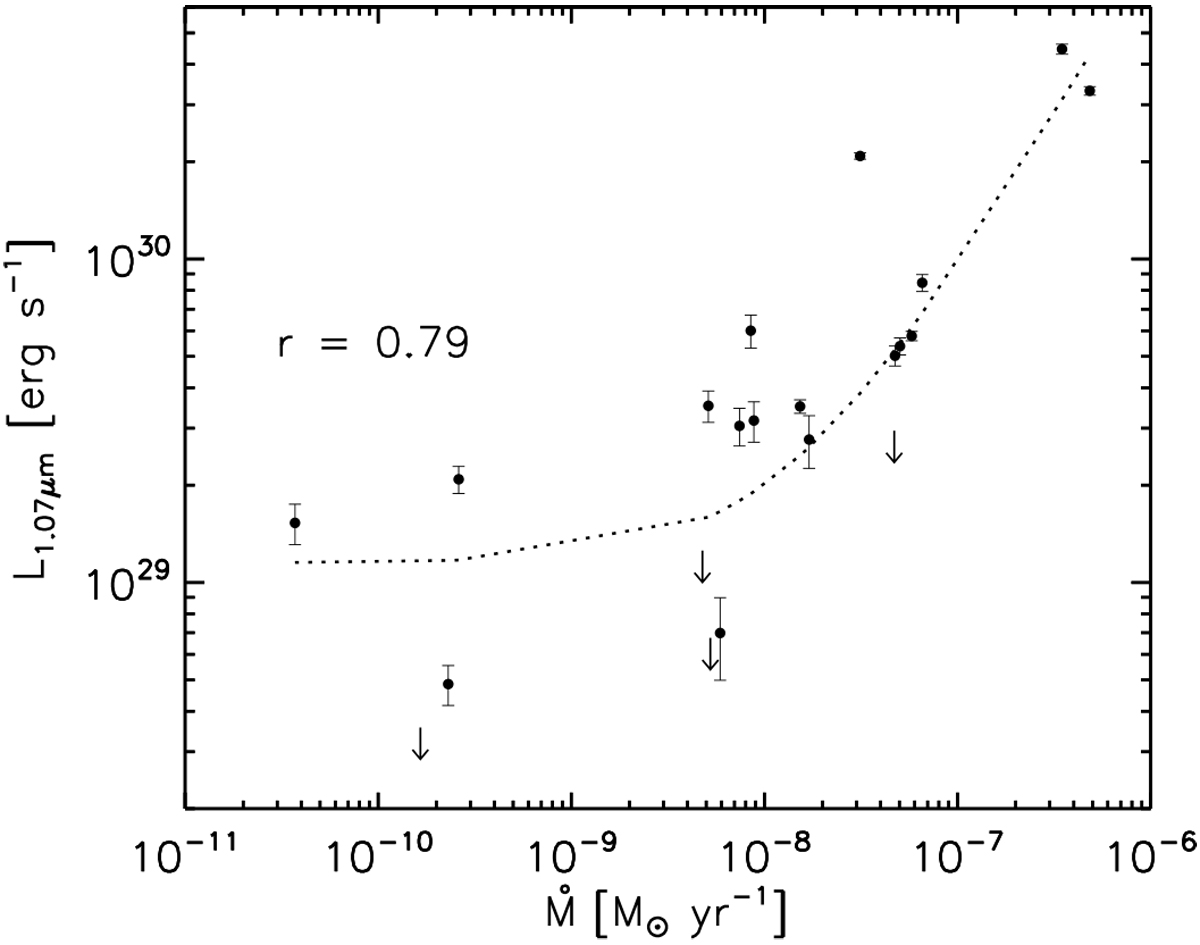
Integrated luminosity of the three strongest lines in the main 1.07 μm C0 complex plotted against the mass accretion rate, Ṁ, calculated from the H0 Brγ line at 2.166 μm. Uncertainties in the C0 line luminosities are included, along with a linear regression fit to the data (dotted line). The Pearson correlation coefficient is 0.79, indicating a high likelihood of association with Ṁ.
Current usage metrics show cumulative count of Article Views (full-text article views including HTML views, PDF and ePub downloads, according to the available data) and Abstracts Views on Vision4Press platform.
Data correspond to usage on the plateform after 2015. The current usage metrics is available 48-96 hours after online publication and is updated daily on week days.
Initial download of the metrics may take a while.