Fig. 1
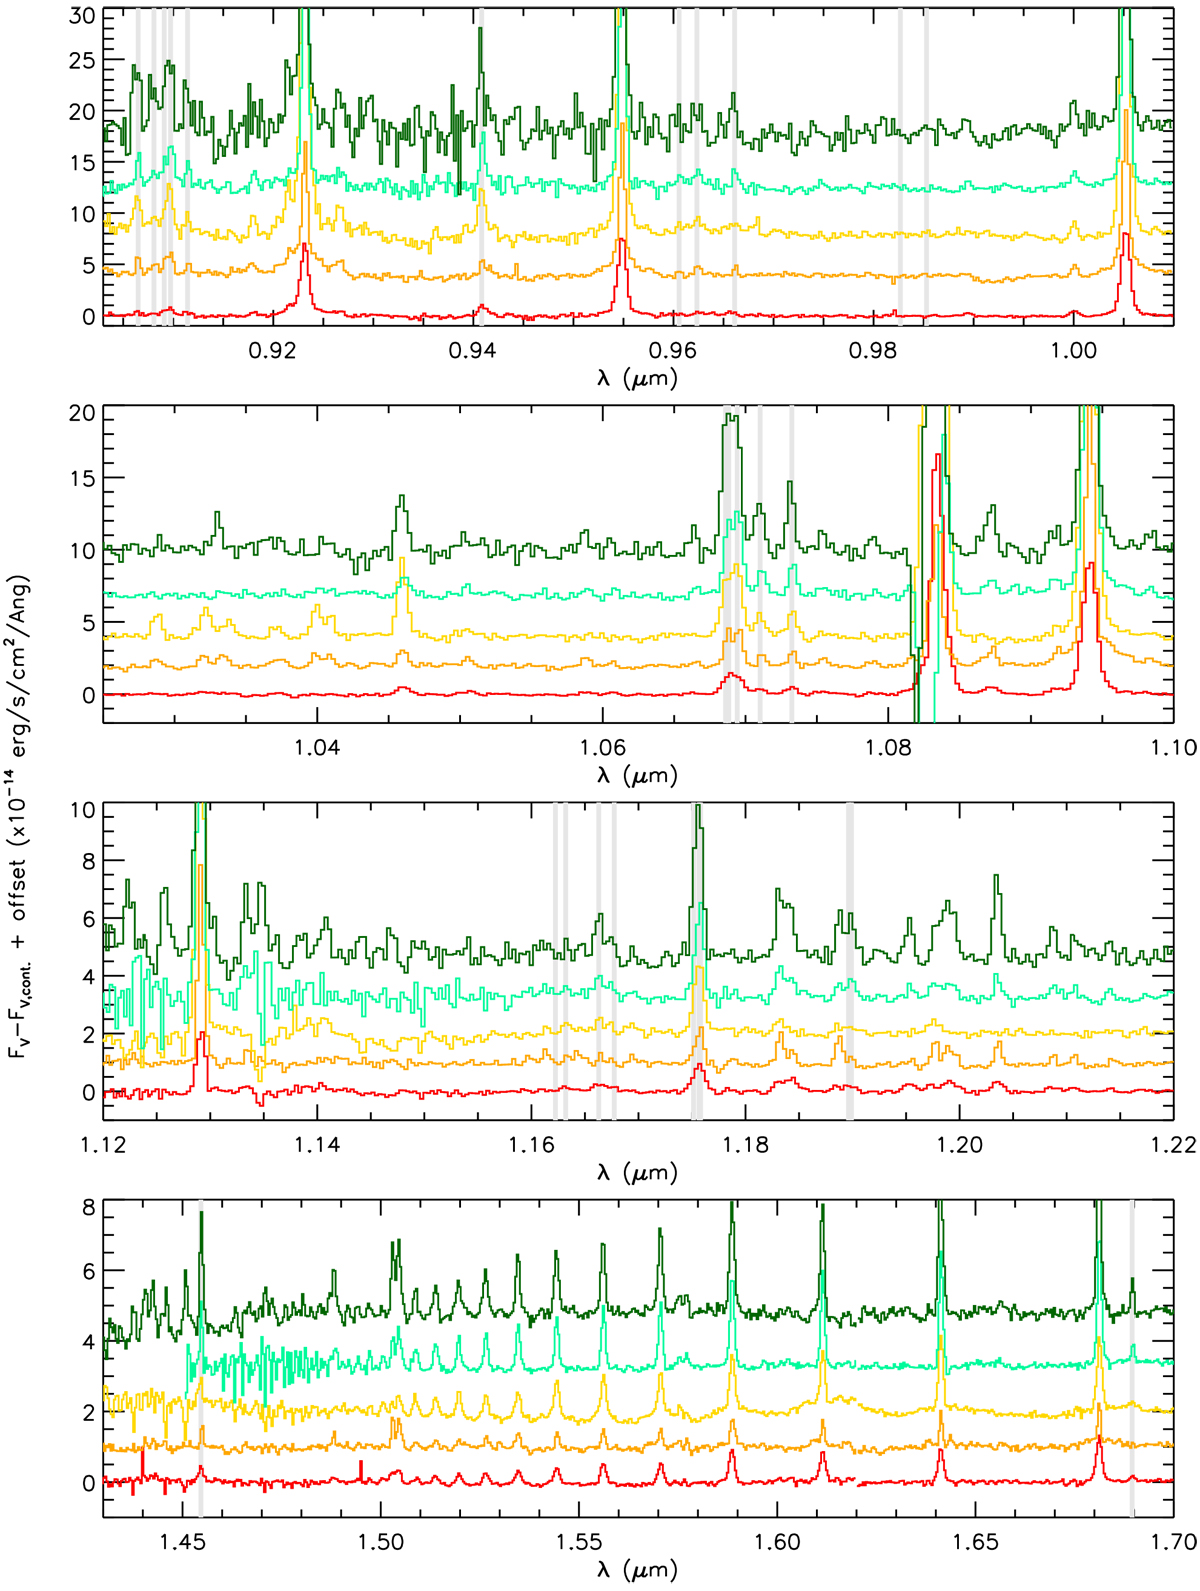
Continuum subtracted excess emission covering the C0 lines for the five disks with the best SN spectrum: FZ Tau, DR Tau, CW Tau, DO Tau, and DL Tau (from top to bottom). Grey vertical lines indicate positions of C0 lines of interest. Note the forbidden lines at 0.982 and 0.985 μm are not detected, in contrast with the permitted lines.
Current usage metrics show cumulative count of Article Views (full-text article views including HTML views, PDF and ePub downloads, according to the available data) and Abstracts Views on Vision4Press platform.
Data correspond to usage on the plateform after 2015. The current usage metrics is available 48-96 hours after online publication and is updated daily on week days.
Initial download of the metrics may take a while.