Fig. 1.
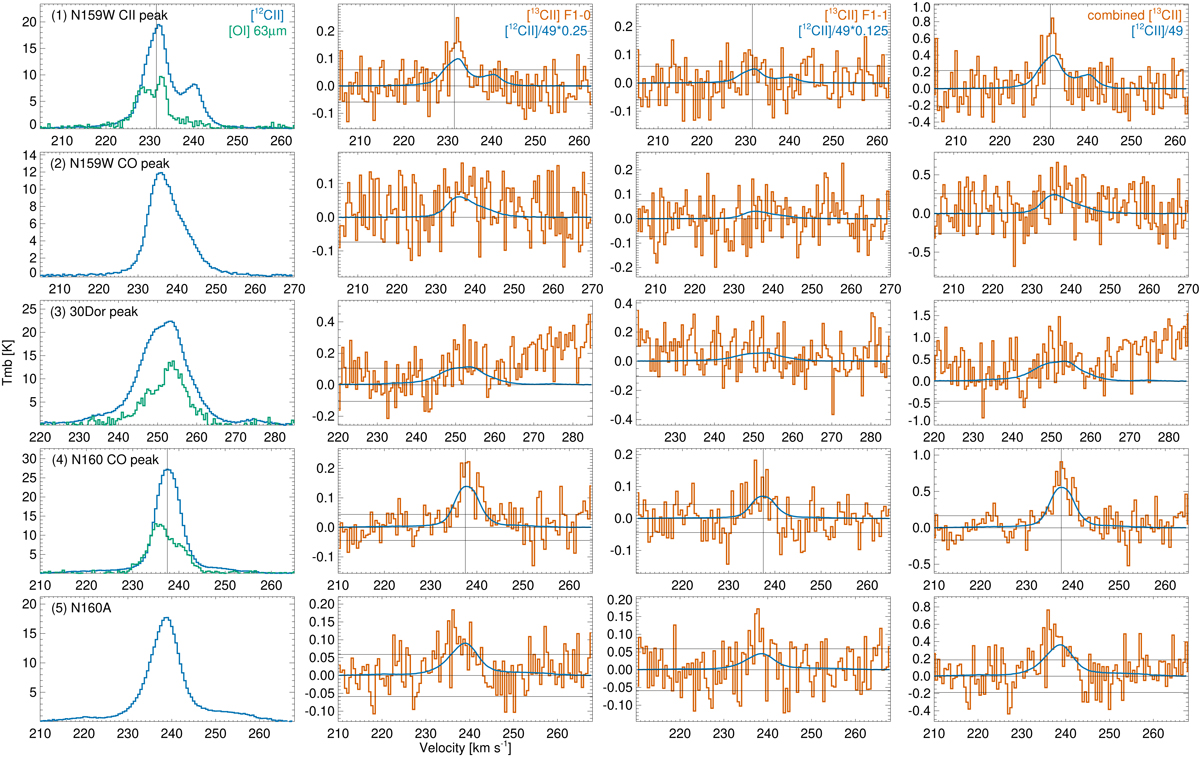
Spectra of [13C II], [12C II], and [O I] at selected positions in the LMC. Left: [12C II] spectra (blue) and [O I] 63 μm spectra when available (green). The vertical lines aid the comparison of the velocities of the line profiles. Middle two panels: [13C II] F = 1−0 and F = 1−1 spectra (red) and [C II] spectra (blue) scaled for optically thin emission and 12C+/13C+ = 49. The horizontal lines indicate the rms noise of the baseline. Right: combined [13C II] spectra (red) and the scaled [C II] spectra (blue). See text for the formula of the combined [13C II] spectra and the scaled [C II] spectra.
Current usage metrics show cumulative count of Article Views (full-text article views including HTML views, PDF and ePub downloads, according to the available data) and Abstracts Views on Vision4Press platform.
Data correspond to usage on the plateform after 2015. The current usage metrics is available 48-96 hours after online publication and is updated daily on week days.
Initial download of the metrics may take a while.