Fig. 3
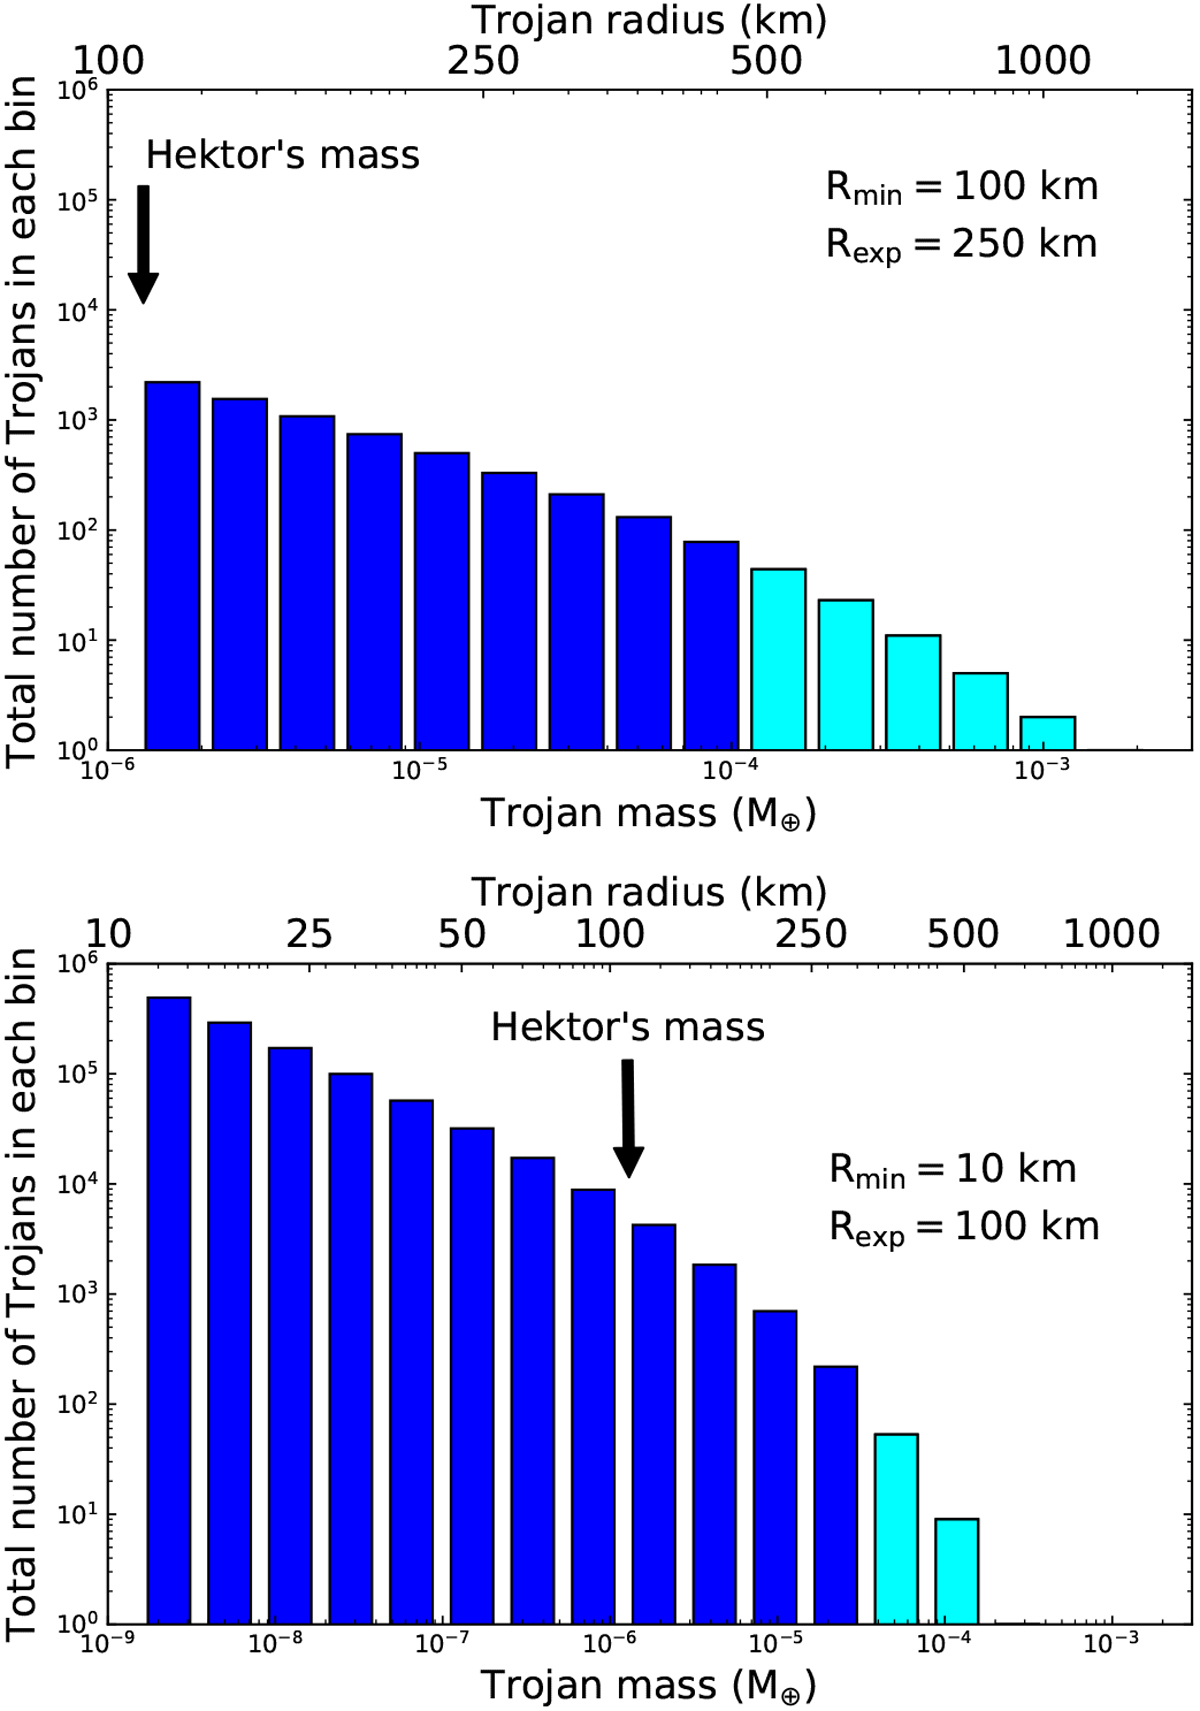
Size frequency distributions of the Jupiter Trojans in the case of Rmin = 100 km and Rexp = 250 km (top histogram) and for Rmin = 10 km and Rexp = 100 km (bottom histogram). The histograms show the number of Trojans in mass bins (bottom x-axis). In the upper x-axes we show the correspondent radius bins (we assumed a density of the Trojans of 1.5 g cm−3). In cyan we highlight the part of the distributions that we substituted into the Trojan swarms as massive bodies. The black arrow indicates the mass of asteroid (624) Hektor, which is the most massive Jupiter Trojan.
Current usage metrics show cumulative count of Article Views (full-text article views including HTML views, PDF and ePub downloads, according to the available data) and Abstracts Views on Vision4Press platform.
Data correspond to usage on the plateform after 2015. The current usage metrics is available 48-96 hours after online publication and is updated daily on week days.
Initial download of the metrics may take a while.