| Issue |
A&A
Volume 631, November 2019
|
|
|---|---|---|
| Article Number | A165 | |
| Number of page(s) | 6 | |
| Section | Extragalactic astronomy | |
| DOI | https://doi.org/10.1051/0004-6361/201936585 | |
| Published online | 15 November 2019 | |
Towards a 1% measurement of the Hubble constant: accounting for time dilation in variable-star light curves
European Southern Observatory, Karl-Schwarzschild-Str. 2, 85748 Garching b. München, Germany
e-mail: This email address is being protected from spambots. You need JavaScript enabled to view it.
Received:
27
August
2019
Accepted:
23
September
2019
Abstract
Assessing the significance and implications of the recently established Hubble tension requires the comprehensive identification, quantification, and mitigation of uncertainties and/or biases affecting H0 measurements. Here, we investigate the previously overlooked distance scale bias resulting from the interplay between redshift and Leavitt laws in an expanding Universe: Redshift-Leavitt bias (RLB). Redshift dilates oscillation periods of pulsating stars residing in supernova-host galaxies relative to periods of identical stars residing in nearby (anchor) galaxies. Multiplying dilated log P with Leavitt Law slopes leads to underestimated absolute magnitudes, overestimated distance moduli, and a systematic error on H0. Emulating the SH0ES distance ladder, we estimate an associated H0 bias of (0.27 ± 0.01)% and obtain a corrected H0 = 73.70 ± 1.40 km s−1 Mpc−1. RLB becomes increasingly relevant as distance ladder calibrations pursue greater numbers of ever more distant galaxies hosting both Cepheids (or Miras) and type-Ia supernovae. The measured periods of oscillating stars can readily be corrected for heliocentric redshift (e.g. of their host galaxies) in order to ensure H0 measurements free of RLB.
Key words: distance scale / stars: oscillations / stars: variables: Cepheids / stars: variables: general / stars: distances / galaxies: distances and redshifts
ESO fellow.
© ESO 2019
1. Introduction
Pulsating stars such as classical Cepheids enable precise measurements of the local expansion rate of the Universe, H0, thanks to the existence of period-luminosity relations (PLRs), or Leavitt laws (Leavitt 1908; Leavitt & Pickering 1912, henceforth: LLs). Using a Cepheids-based distance ladder, the SH0ES team (Riess et al. 2016; henceforth R+16) recently established a systematic difference between the present-day value of H0 and the value inferred based on cosmic microwave background observations by the Planck Collaboration VI (2018) assuming the concordance cosmological model (flat ΛCDM). Following further improvements to the distance ladder (e.g. Riess et al. 2018, 2019), and considering Cepheid-independent routes to measure H0 (e.g. Wong et al. 2019; Freedman et al. 2019; Yuan et al. 2019), the so-called Hubble tension now figures at a significance of 4 − 6σ, sparking an increasing number of suggested modifications to ΛCDM (for a detailed overview, see Verde et al. 2019, and references therein).
The SH0ES distance ladder consists of three rungs that are fitted globally (cf. Appendix in R+16). The first rung involves the calibration of the Cepheid LL in relatively nearby, so-called “anchor” galaxies whose distances are known. The second rung consists of so-called “SN-host” galaxies, where both Cepheids and type-Ia supernovae (SNe Ia) have been observed: SN-host galaxies thus set the luminosity zero-point for SNe Ia. The third, final rung consists of the Hubble diagram of SNe Ia. The intercept of this Hubble diagram provides the measurement of H0. Almost all SN-host galaxies are more distant than the anchor galaxies, with the exception of M 101, which is approximately 0.9 Mpc closer than the anchor galaxy NGC 4258. Following an improvement of the distance to NGC 4258, the latest H0 = 73.5 ± 1.4 km s−1 Mpc−1 (Reid et al. 2019).
Following impressive gains in H0 precision and the importance of H0 for informing modifications to ΛCDM, the identification and mitigation of previously overlooked H0 uncertainties and biases is rapidly gaining importance. Notably, the effects of stellar association bias (Anderson & Riess 2018) are now taken into account in the H0 measurement (Riess et al. 2019).
A key bottleneck for increasing H0 precision is the number of SN-host galaxies. At present, Cepheids can be measured with good precision in galaxies up to ∼40 Mpc distant (R+16), and large efforts are in progress to increase the number of SN-host galaxies from currently 19–38 (Riess et al. 2019). However, the rather low volumetric rate of SNe Ia explosions requires exploring alternative primary distance indicators capable of probing greater distances, such as Mira-variable stars (e.g. Whitelock et al. 2008; Yuan et al. 2017; Huang et al. 2018, 2019; Bhardwaj et al. 2019), especially considering the short mission duration of the James Webb Space Telescope (JWST). Adding new SN-host galaxies to the distance ladder will therefore tend to include more distant galaxies and increase average SN-host galaxy redshift due to the Hubble–Lemaître law (Wirtz 1924; Lemaître 1927; Hubble 1929).
The longitudinal Doppler effect shifts the oscillation frequency emitted by a source as a function of its radial (line-of-sight) velocity, vr. Time dilation due to cosmological redshift  slows down clocks in a mathematically approximately identical way in the case of small
  and non-relativistic velocities (vr ≪ c). Thus, time dilation of the type Ia supernova SN 1995K enabled observational proof of the Universe’s expansion (Leibundgut et al. 1996). Several studies have considered the impact of inaccuracies related to redshift measurements of SNe Ia (e.g. Hui & Greene 2006; Davis et al. 2011, 2019) on H0 and the dark energy equation of state. Additionally, the impact of Doppler frequency shifts for asteroseismic inferences was studied by Davies et al. (2014) and is gaining importance for measuring orbital motion in pulsating stars (Murphy et al. 2014). However, the impact of systematic differences in (observed heliocentric) redshift between anchor and SN-host galaxies on variable-star periods and the H0 measurement has hitherto remained unexplored.
This article investigates the relevance and impact of dilated variable-star periods on the measurement of H0. Specifically, Sect. 2 explains the distance bias arising from cosmic expansion, the Doppler effect, and the Leavitt law in the case of Cepheids and Mira stars. Section 3 estimates the impact on the latest H0 measurement involving Cepheids and SNe Ia. Section 4 discusses these findings in the context of future distance ladders based on Mira-variable stars in the era of the JWST. Finally, Sect. 5 summarises this work and presents its conclusions.
2. Redshift-Leavitt bias (RLB)
The observed total redshift of an extragalactic source relative to the observer is a combination of cosmological redshift ( ), peculiar motion of the galaxy (
 ), peculiar motion of the observer (zpec), and gravitational redshift of the galaxy (
 ) and the observer (zϕ). Once corrected to the heliocentric reference frame, the observed redshift zobs is (Calcino & Davis 2017, their Eq. (2.2)):
 (1)
(1)
Variability periods of extragalactic variable stars such as classical Cepheids are subject to both time dilation due to cosmological redshift (mostly relevant for Cepheids outside the Local Group), and the Doppler effect due to line-of-sight motions such as peculiar velocities, velocity dispersions, partial sampling of a galaxy’s rotation curve, orbital motion, etc. Since the latter velocities are usually ≲1000 km s−1, such Doppler shifts can be treated non-relativistically to very good approximation. The observed redshift of an individual variable star in another galaxy is thus:
 (2)
(2)
where vr, i is the line-of-sight component of the star’s motion relative to the heliocentric reference frame, not counting peculiar motion, which is already included as part of Eq. (1). Of course, vr, i of individual Cepheids is currently measurable only in the Milky Way and Magellanic Clouds, where cosmological redshift is negligible. For individual variable stars in other galaxies, internal motions due to velocity dispersion and partially sampled rotation curves can lead to vr, i/c ≲ 10−3. However, most observed populations of Cepheids in SN-host galaxies sample all parts of their host galaxy disks, which furthermore tend to be oriented relatively face-on. Hence, no significant net effect is to be expected for a typical SN-host galaxy’s Cepheid population as a whole, meaning, ⟨vr⟩≈0. For partially sampled galaxies (e.g. the PHAT footprint of M 31, cf. Dalcanton et al. 2012), disk or halo rotation could lead to a net ⟨vr⟩≲ ± 300 km s−1, which would be comparable to the effect of  at distances ≲4 Mpc.
Galaxy catalogs list redshifts (zobs) measured as the displacement of spectral lines relative to their rest-wavelength λ0, corrected to the heliocentric reference frame (e.g. Huchra et al. 1992):
 (3)
(3)
zobs does not distinguish between the physical origin of redshift, and includes all terms listed in Eq. (1). However, it does not account for motions of individual stars (vr, i) or velocity differences across a galaxy. In the following, we neglect these latter two contributions since Cepheid populations are usually distributed across the full disks of SN-host galaxies, which are usually oriented face-on (R+16). However, observers may consider accounting for net effects, due to galaxy rotation at distances ≲40 Mpc, if these conditions are not fulfilled.
Using zobs, we calculated the effect of time dilation on variable-star periods (cf. Fig. 2) as
 (4)
(4)
 (5)
(5)
where we use log B = log(1 + zobs) for brevity.
Leavitt Laws relate oscillation periods of certain pulsating star types to absolute magnitudes M. The most common functional form is linear in log P and is used, for example, for classical Cepheid variables:
 (6)
(6)
where a and b are calibrated using objects at known distances (ideally from geometry), for example, via Gaia parallaxes (Brown et al. 2018; Lindegren et al. 2018), detached eclipsing binaries in the LMC (Pietrzyński et al. 2019), or the parallax of the mega-maser in NGC 4258 (Humphreys et al. 2013).
Non-linear LLs have also been considered, for example, broken PLRs for Cepheids (e.g. Bhardwaj et al. 2016), PLRs affected by metallicity (e.g. Sesar et al. 2017; Gieren et al. 2018; Delgado et al. 2019, especially for RR Lyrae stars observed in the infrared). LLs are noticeably non-linear for Mira stars, where quadratic LLs have been used (e.g. Yuan et al. 2017; Huang et al. 2018):
 (7)
(7)
In the following, we adopt b = −3.26 for a linear LL appropriate for Cepheids (H-band Wesenheit PL-slope from R+16) and b1 = −3.59, b2 = −3.40, and log Pref = 2.3 (Huang et al. 2018) for quadratic LLs.
Absolute magnitudes inferred using LLs, MLL, are biased by the effect of time dilation on oscillation periods, cf. Fig. 1. With Eqs. (5)–(7), we obtain
![Mathematical equation: $$ \begin{aligned} \Delta M&= M_{\mathrm{LL}} - M_0\nonumber \\&= b\Delta \log {P} = b\log {B}&\small {[\mathrm{lin\, LL}]}\nonumber \\&= b_1 \log {B} + b_2 \log {B} \left( 2 \log {P_{\mathrm{obs}}\prime } - \log {B} \right)&\small {[\mathrm{quad\, LL}]}, \end{aligned} $$](/articles/aa/full_html/2019/11/aa36585-19/aa36585-19-eq14.gif) (8)
(8)
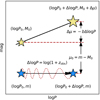 |
Fig. 1. Not-to-scale visual representation of Redshift-Leavitt bias. SN-hosts are redshifted relative to anchor galaxies. Observed oscillation frequencies of Cepheids, Miras, and other variable stars, are subject to time dilation, i.e., observed periods are longer than emitted periods. This translates to a distance modulus bias due to the slope of Leavitt laws. |
where the second line applies to linear LLs and the third line to quadratic LLs. For linear LLs, the bias depends only on b and the observed heliocentric redshift. For quadratic LLs, RLB depends on zobs, b1, and b2, as well as the pivot period Pref, since  .
.
The resulting bias in distance modulus is therefore:
 (9)
(9)
Inserting Eq. (8) in Eq. (9) we obtain:
![Mathematical equation: $$ \begin{aligned} \Delta \mu =&- b\log {B}&\small {\mathrm{[lin\, LL]}} \nonumber \\ \Delta \mu =&- b_1 \log {B} - b_2 \log {B} \left( 2 \log {P_{\mathrm{obs}}\prime } - \log {B} \right)&\small {\mathrm{[quad\, LL]}}. \end{aligned} $$](/articles/aa/full_html/2019/11/aa36585-19/aa36585-19-eq17.gif) (10)
(10)
Figure 3 illustrates Δμ for a wide range of zobs. We notice that (a) (log B)2 ∼ 10−4 is negligible at distances < 100 Mpc, and (b)  can be minimized by using a pivot log Pref close to the sample average. However, any galaxy is expected to show a distribution of Mira periods, so that time dilation could lead to a small apparent LL slope change in a given galaxy if redshift is not accounted for.
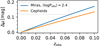 |
Fig. 3. Redshift-Leavitt bias for Cepheids and Miras with mean ⟨log Pobs⟩ = 2.4 whose LL is calibrated at log Prmref = 2.3, cf. Eqs. (6) and (7). |
With μ = 5 log d + 25 (d in Mpc), the ratio of the true distance d0 to the biased distance dLL is:
 (11)
(11)
With Eqs. (10) and (11) becomes:
![Mathematical equation: $$ \begin{aligned} d_0&= d_{\mathrm{LL,lin}} \cdot 10^{0.2 b\log {B} } \nonumber \\ d_0&= d_{\mathrm{LL,quad}} \cdot 10^{0.2 \left[ b_1 \log {B} + b_2 \log {B} \left( 2 \log {P_{\mathrm{obs}}\prime } - \log {B} \right) \right] } \end{aligned} $$](/articles/aa/full_html/2019/11/aa36585-19/aa36585-19-eq20.gif) (12)
(12)
for linear and quadratic LLs, respectively. Since b, b1, and b2 are all negative, and log B ≥ 1, this typically means that d0 < dLL. We notice that the term  can be negative or positive, depending on pivot period and average log Pobs. In the following, we consider the small difference between log Pref = 2.3 and ⟨log Pobs⟩ = 2.4, which corresponds to the case of Miras in NGC 4258 (Huang et al. 2018, “Gold” sample in their Table 6).
Figure 4 illustrates RLB as a function of distance assuming H0 = 74 km s−1 Mpc−1 and redshift caused by cosmic expansion only. The slightly steeper slopes of Mira LLs imply a slightly stronger susceptibility to RLB compared to Cepheids. For quadratic LLs, more significant differences result from possible differences among the average observed and pivot period (if  ).
).
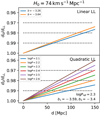 |
Fig. 4. Relative distance error as function of distance in case of cosmological redshift (considers only expansion). Relative distance errors of 1, 2, and 3% are shown by horizontal dotted lines. For Cepheids, we adopt b = −3.26 (corresponds to the H-band Period–Wesenheit relation using F160W, F555W, and F814W in R+16), for Miras b1 = −3.59, b2 = −3.40, and log Pref = 2.3 from Huang et al. (2018). If left uncorrected, RLB affects Cepheids at the 1% (2%) level for d > 62 Mpc (d > 123 Mpc). For Miras of mean log Pobs = 2.4, the 1% (2%) bias level is reached sooner, at d > 47.5 Mpc (d > 95 Mpc). |
H0 is measured as the intercept of the Hubble diagram, ax (cf. Eqs. (5) and (9) in R+16, subscript x denotes photometric band) via
 (13)
(13)
With Eq. (13) and  , we obtain:
![Mathematical equation: $$ \begin{aligned} H_{0,\mathrm{true}}&= H_{0,\mathrm{LL,lin}} \cdot 10^{-0.2 b\log {B} } \nonumber \\ H_{0,\mathrm{true}}&= H_{0,\mathrm{LL,quad}} \cdot 10^{-0.2 \left[ b_1 \log {B} + b_2 \log {B} \left( 2 \log {P_{\mathrm{obs}}\prime } - \log {B} \right) \right] } \end{aligned} $$](/articles/aa/full_html/2019/11/aa36585-19/aa36585-19-eq25.gif) (14)
(14)
for linear and quadratic LLs, respectively, where H0, true > H0, LL since b, b1, b2 all < 0, and log B = log(1 + zobs) > 0. Hence, the Universe is expanding slightly faster than previously reported based on the Cepheid-based distance ladder (R+16; Riess et al. 2018, 2019; Reid et al. 2019). In Sect. 3, we estimate this effect and the correction for H0, and underline the importance of correcting variability periods for time dilation when measuring distances exceeding 40 Mpc using Mira stars with JWST.
3. Correcting H0 for RLB
We now estimate RLB as it applies to the SH0ES Cepheids-based distance ladder (R+16) and the corresponding H0 measurement. To this end, we compiled measured heliocentric redshifts from NED1 as well as other relevant information for the anchor and SN-host galaxies. Table 1 provides this information for convenience.
Information used to estimate redshift-Leavitt bias for anchor and SN-host galaxies in SH0ES Cepheids-based distance ladder (R+16).
We first determine the difference between the mean redshift of LL anchor galaxies and the mean redshift of SN-host galaxies used for measuring H0. The σPL-weighted average observed redshift of anchor galaxies is ⟨zobs, cal⟩≈0.48 × 10⁻³. For Milky Way Cepheids, we adopt vr = 0 km s−1, as expected for a random distribution of radial velocities. Any deviations from null velocity are on the order of 10 km s−1 and can be comfortably neglected. For SN-host galaxies, the σPL-weighted average redshift is ⟨zobs, LL⟩≈4.76 × 10⁻³, and the average redshift difference between anchor and SN-host galaxies is Δzobs = 4.28 × 10⁻³. In the following, we use log B = log(1 + Δzobs) to calculate RLB and the bias of H0.
Figure 5 shows d0/dLL for all 19 SH0ES SN-host galaxies individually, as well as sample averages including the σPL-weighted average (dark red solid lines), the average weighted by number of Cepheids, Ncep (dashed), and the un-weighted average (dotted). For the σPL-weighted average, we find ⟨d0/dLL⟩σPL ≈ 0.99721. Using the NCep-weighted average, we find ⟨d0/dLL⟩NCep ≈ 0.99748. Any uncertainty contribution due to redshift uncertainties is minimal, since ⟨σz/z⟩ = 0.004 restricts variations in Δlog P ≲ 10−5.
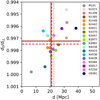 |
Fig. 5. Relative distance error incurred due to RLB, cf. Eq. (11). zobs was translated to distance assuming H0 = 74 km s−1 Mpc−1; scatter in the relation arises from peculiar velocities. The dark red solid, dashed, and dotted crosses indicate the average values obtained for different weightings. Solid lines: weighted according to σPL in Table 1, ⟨d0/dLL⟩ = 0.9972. Dashed lines: weighted according to NCep in Table 1. Dotted lines: unweighted mean distance and bias, ⟨d0/dLL⟩ = 0.9975. |
For H0 = 73.50 ± 1.40 km s−1 Mpc−1 (Reid et al. 2019) and Δzobs = 4.28 × 10⁻³, Eq. (14) yields H0, true = 73.70 ± 1.40 km s−1 Mpc−1, i.e., an increase of ΔH0 = 0.20 ± 0.01 km s−1 Mpc−1. Thus, RLB amounts to 14% of the reported total uncertainty on H0 of 1.90%. The small shift in H0 slightly increases the significance of the tension between Planck and the SH0ES distance ladder from 4.1σ to 4.2σ.
Analogously, we estimate biases of 0.19% and 0.20% for recent Mira-based H0 measurements by Huang et al. (2019) that used linear Mira LL slopes of b = −3.64 and −3.35. In this case, NGC4258 was the sole anchor, and NGC 1559 (Koribalski et al. 2004, zobs, N1559 = 4.35 × 10⁻³) the sole SN-host galaxy.
Of course, the above is a somewhat crude, first-order estimation of the degree by which previous H0 measurements are affected by RLB. Future H0 measurements should take into account the dilation of observed oscillation periods using Eq. (5) to avoid RLB. Section 4 highlights why this correction is required to elucidate Hubble tension using a future distance ladder based on more distant Mira stars.
4. Discussion
Time dilation can affect any oscillating star’s variability period and lead to distance bias whenever there is a net redshift difference among the LL calibration set and the population where LLs are being applied. Besides the aforementioned Cepheid, RR Lyr, and Mira stars, many other classes of pulsating stars, including δ Scuti stars, type-II Cepheids, and long-period oscillating red giants obey PLRs that render them potentially useful as standard candles (e.g. Ziaali et al. 2019; Matsunaga et al. 2011; Kiss & Bedding 2003).
Mira stars are of particular importance due to their high luminosity and large amplitudes for future distance ladder calibration using JWST. Mira stars observed with JWST should significantly extend the distance d within which SNe Ia luminosity be cross-calibrated. Since volume increases as d3, and the probability of a SN Ia exploding depends on volume, it follows that most new SN-host galaxies observed with JWST should reside at significantly greater distance than the current SH0ES SN-host galaxies. Due to the Hubble–Lemaître law, the redshift difference among anchor and SN-host galaxies should therefore be enhanced in the era of the Mira-JWST distance ladder.
Figure 4 illustrates this effect, and shows that RLB of a sample of Miras with ⟨log Pobs⟩ = 2.5 (316 d) exceeds 2% at Coma cluster distances of 100 Mpc. Moreover, the intra-cluster velocity dispersion σvpec, Coma ≈ 1000 km s−1 (Sohn et al. 2017, and references therein) could differentially bias distances of Coma cluster galaxies by 1 − 2%, potentially affecting the interpretation of galaxy cluster scales.
According to Eq. (12), a mismatch between the average period of a sample of Miras and the pivot period of quadratic LLs can further increase RLB. Assuming log Pref = 2.3, a bias of 1% is reached at 37, 42, 48, 57, 71, and 93 Mpc for locally calibrated Miras of log P = 2.6, 2.5, 2.4, 2.3, 2.2, and 2.1, respectively. Alternatively expressed, at 60 Mpc, individual Mira stars would be biased by between 0.7% and 1.7%, depending on their period.
RLB depends on LL slopes, which depend on photometric passbands. For example, the H-band LL in R+16 has slightly shallower slope (bH = −3.06) than the near-IR Wesenheit LL (bW = −3.26). Hence, the H-band Cepheid LL is less affected by RLB than the near-IR Wesenheit-LL. Analogously, different kinds of oscillating stars exhibiting shallower LL slopes are also less strongly affected by RLB. For example, the slope of the period term in the K-band RR Lyrae PL-metallicity relation has slope of approximately −2.4 (e.g. Barth et al. 2002; Minniti et al. 2003), reducing the effect compared to Cepheids or Miras.
Thankfully, RLB is easily avoided by correcting observed oscillation periods for time dilation effects. In the continued pursuit of measuring H0 with 1% accuracy, this effect can and must be accounted for.
5. Conclusions
The Universe’s expansion leads to a subtle, distance-dependent dilation of variability periods in oscillating stars. If left uncorrected, this systematic change in variability period biases distance estimates based on Leavitt laws along the distance ladder, because more distant stars are assumed to be more luminous than they truly are. Due to the interplay between redshift and Leavitt law slopes, we term this effect Redshift-Leavitt bias (RLB).
RLB results in overestimated distances and thus leads to an underestimated value of the Universe’s local expansion rate H0. Emulating the SH0ES distance ladder (Riess et al. 2016, 2018, 2019; Reid et al. 2019), we estimate a bias of ΔH0/H0 = 0.27 ± 0.01%. Applying this first-order correction to the H0 reported by Reid et al. (2019), we obtain ΔH0 = 0.20 ± 0.01 km s−1 Mpc−1 and a de-biased H0 = 73.70 ± 1.40 km s−1 Mpc−1. The slight increase of H0 increases the significance of the Hubble tension between the “early-universe” value by the Planck Collaboration VI (2018, H0 = 67.4 ± 0.5 km s−1 Mpc−1) and the Cepheids-based distance ladder to 4.2σ.
With oscillating stars being observed at increasing distances, correcting variable-star oscillation periods for time dilation due to redshift becomes increasingly important. For the highly promising Mira stars, we estimate H0 bias of order 2 − 3% if this effect is not accounted for. Hence, a future Mira-based distance ladder requires correcting variability periods for time dilation.
Acknowledgments
The author is pleased to thank the anonymous referee for a timely and constructive report, Adam G. Riess and Stefano Casertano for useful comments on an earlier draft, as well as Bruno Leibundgut, Jason Spyromilio, and Steven Kawaler for useful discussions. This research has made use of NASA’s Astrophysics Data System.
References
- Anderson, R. I., & Riess, A. G. 2018, ApJ, 861, 36 [NASA ADS] [CrossRef] [Google Scholar]
- Barth, A. J., Ho, L. C., & Sargent, W. L. W. 2002, AJ, 124, 2607 [NASA ADS] [CrossRef] [Google Scholar]
- Bhardwaj, A., Kanbur, S. M., Macri, L. M., et al. 2016, MNRAS, 457, 1644 [NASA ADS] [CrossRef] [Google Scholar]
- Bhardwaj, A., Kanbur, S., He, S., et al. 2019, ApJ, 884, 20 [NASA ADS] [CrossRef] [Google Scholar]
- Brown, A. G. A., Vallenari, A., Prusti, T., et al. 2018, A&A, 616, A1 [NASA ADS] [CrossRef] [EDP Sciences] [Google Scholar]
- Bureau, M., Mould, J. R., & Staveley-Smith, L. 1996, ApJ, 463, 60 [NASA ADS] [CrossRef] [Google Scholar]
- Calcino, J., & Davis, T. 2017, JCAP, 1, 038 [NASA ADS] [CrossRef] [Google Scholar]
- Dalcanton, J. J., Williams, B. F., Lang, D., et al. 2012, ApJS, 200, 18 [NASA ADS] [CrossRef] [Google Scholar]
- Davis, T. M., Hui, L., Frieman, J. A., et al. 2011, ApJ, 741, 67 [NASA ADS] [CrossRef] [Google Scholar]
- Davies, G. R., Handberg, R., Miglio, A., et al. 2014, MNRAS, 445, L94 [NASA ADS] [CrossRef] [Google Scholar]
- Davis, T. M., Hinton, S. R., Howlett, C., & Calcino, J. 2019, MNRAS, 490, 2948 [NASA ADS] [CrossRef] [Google Scholar]
- de Vaucouleurs, G., de Vaucouleurs, A., Corwin, Jr., H. G., et al. 1991, Third Reference Catalogue of Bright Galaxies. Volume I: Explanations and References. Volume II: Data for Galaxies Between 0h and 12h. Volume III: Data for Galaxies Between 12h and 24h [Google Scholar]
- Delgado, H. E., Sarro, L. M., Clementini, G., Muraveva, T., & Garofalo, A. 2019, A&A, 623, A156 [NASA ADS] [CrossRef] [EDP Sciences] [Google Scholar]
- Freedman, W. L., Madore, B. F., Hatt, D., et al. 2019, ApJ, 882, 34 [NASA ADS] [CrossRef] [Google Scholar]
- Gieren, W., Storm, J., Konorski, P., et al. 2018, A&A, 620, A99 [NASA ADS] [CrossRef] [EDP Sciences] [Google Scholar]
- Grogin, N. A., Geller, M. J., & Huchra, J. P. 1998, ApJS, 119, 277 [NASA ADS] [CrossRef] [Google Scholar]
- Guthrie, B. N. G., & Napier, W. M. 1996, A&A, 310, 353 [NASA ADS] [Google Scholar]
- Huang, C. D., Riess, A. G., Hoffmann, S. L., et al. 2018, ApJ, 857, 67 [NASA ADS] [CrossRef] [Google Scholar]
- Huang, C. D., Riess, A. G., Yuan, W., et al. 2019, ApJ, submitted [arXiv:1908.10883] [Google Scholar]
- Hubble, E. 1929, Proc. Natl. Acad. Sci., 15, 168 [Google Scholar]
- Huchra, J. P., Geller, M. J., Clemens, C. M., Tokarz, S. P., & Michel, A. 1992, Bulletin d’Information du Centre de Donnees Stellaires, 41, 31 [NASA ADS] [Google Scholar]
- Hui, L., & Greene, P. B. 2006, Phys. Rev. D, 73, 123526 [NASA ADS] [CrossRef] [Google Scholar]
- Humphreys, E. M. L., Reid, M. J., Moran, J. M., Greenhill, L. J., & Argon, A. L. 2013, ApJ, 775, 13 [Google Scholar]
- Kent, B. R., Giovanelli, R., Haynes, M. P., et al. 2008, AJ, 136, 713 [Google Scholar]
- Kiss, L. L., & Bedding, T. R. 2003, MNRAS, 343, L79 [NASA ADS] [CrossRef] [Google Scholar]
- Koribalski, B. S., Staveley-Smith, L., Kilborn, V. A., et al. 2004, AJ, 128, 16 [NASA ADS] [CrossRef] [Google Scholar]
- Krumm, N., & Salpeter, E. E. 1980, AJ, 85, 1312 [NASA ADS] [CrossRef] [Google Scholar]
- Lauberts, A., & Valentijn, E. A. 1989, The Surface Photometry Catalogue of the ESO-Uppsala Galaxies, 504 [Google Scholar]
- Leavitt, H. S. 1908, Ann. Harv. Coll. Obs., 60, 87 [Google Scholar]
- Leavitt, H. S., & Pickering, E. C. 1912, Harv. Coll. Obs. Circ., 173, 1 [Google Scholar]
- Leibundgut, B., Schommer, R., Phillips, M., et al. 1996, ApJ, 466, L21 [NASA ADS] [CrossRef] [Google Scholar]
- Lemaître, G. 1927, Annales de la Société Scientifique de Bruxelles, 47, 49 [NASA ADS] [Google Scholar]
- Lindegren, L., Hernández, J., Bombrun, A., et al. 2018, A&A, 616, A2 [NASA ADS] [CrossRef] [EDP Sciences] [Google Scholar]
- Matsunaga, N., Feast, M. W., & Soszyński, I. 2011, MNRAS, 413, 223 [NASA ADS] [CrossRef] [Google Scholar]
- Meyer, M. J., Zwaan, M. A., Webster, R. L., et al. 2004, MNRAS, 350, 1195 [NASA ADS] [CrossRef] [Google Scholar]
- Minniti, D., Borissova, J., Rejkuba, M., et al. 2003, Science, 301, 1508 [Google Scholar]
- Murphy, S. J., Bedding, T. R., Shibahashi, H., Kurtz, D. W., & Kjeldsen, H. 2014, MNRAS, 441, 2515 [Google Scholar]
- Pietrzyński, G., Graczyk, D., Gallenne, A., et al. 2019, Nature, 567, 200 [NASA ADS] [CrossRef] [Google Scholar]
- Planck Collaboration VI. 2018, A&A, submitted [arXiv:1807.06209] [Google Scholar]
- Reid, M. J., Pesce, D. W., & Riess, A. G. 2019, ArXiv e-prints [arXiv:1908.05625] [Google Scholar]
- Richter, O.-G., Tammann, G. A., & Huchtmeier, W. K. 1987, A&A, 171, 33 [NASA ADS] [Google Scholar]
- Riess, A. G., Macri, L. M., Hoffmann, S. L., et al. 2016, ApJ, 826, 56 [NASA ADS] [CrossRef] [Google Scholar]
- Riess, A. G., Casertano, S., Yuan, W., et al. 2018, ApJ, 861, 126 [Google Scholar]
- Riess, A. G., Casertano, S., Yuan, W., Macri, L. M., & Scolnic, D. 2019, ApJ, 876, 85 [NASA ADS] [CrossRef] [Google Scholar]
- Schneider, S. E., Thuan, T. X., Mangum, J. G., & Miller, J. 1992, ApJS, 81, 5 [NASA ADS] [CrossRef] [Google Scholar]
- Sesar, B., Fouesneau, M., Price-Whelan, A. M., et al. 2017, ApJ, 838, 107 [NASA ADS] [CrossRef] [Google Scholar]
- Sohn, J., Geller, M. J., Zahid, H. J., et al. 2017, ApJS, 229, 20 [NASA ADS] [CrossRef] [Google Scholar]
- Strauss, M. A., Huchra, J. P., Davis, M., et al. 1992, ApJS, 83, 29 [NASA ADS] [CrossRef] [EDP Sciences] [Google Scholar]
- Verde, L., Treu, T., & Riess, A. G. 2019, Nat. Astron., 3, 891 [NASA ADS] [CrossRef] [Google Scholar]
- Verheijen, M. A. W., & Sancisi, R. 2001, A&A, 370, 765 [NASA ADS] [CrossRef] [EDP Sciences] [Google Scholar]
- Whitelock, P. A., Feast, M. W., & Van Leeuwen, F. 2008, MNRAS, 386, 313 [NASA ADS] [CrossRef] [Google Scholar]
- Wirtz, C. 1924, Astron. Nachr., 222, 21 [NASA ADS] [CrossRef] [Google Scholar]
- Wong, O. I., Ryan-Weber, E. V., Garcia-Appadoo, D. A., et al. 2006, MNRAS, 371, 1855 [NASA ADS] [CrossRef] [Google Scholar]
- Wong, K. C., Suyu, S. H., Chen, G. C. F., et al. 2019, MNRAS, submitted [arXiv:1907.04869] [Google Scholar]
- Yuan, W., Macri, L. M., He, S., et al. 2017, AJ, 154, 149 [NASA ADS] [CrossRef] [Google Scholar]
- Yuan, W., Riess, A. G., Macri, L. M., Casertano, S., & Scolnic, D. 2019, ApJ, submitted [arXiv:1908.00993] [Google Scholar]
- Ziaali, E., Bedding, T. R., Murphy, S. J., Van Reeth, T., & Hey, D. R. 2019, MNRAS, 486, 4348 [NASA ADS] [CrossRef] [Google Scholar]
All Tables
Information used to estimate redshift-Leavitt bias for anchor and SN-host galaxies in SH0ES Cepheids-based distance ladder (R+16).
All Figures
|
Fig. 1. Not-to-scale visual representation of Redshift-Leavitt bias. SN-hosts are redshifted relative to anchor galaxies. Observed oscillation frequencies of Cepheids, Miras, and other variable stars, are subject to time dilation, i.e., observed periods are longer than emitted periods. This translates to a distance modulus bias due to the slope of Leavitt laws. |
| In the text | |
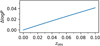 |
Fig. 2. Dilation of logarithmic oscillation period as a function of redshift, cf. Eq. (5). |
| In the text | |
|
Fig. 3. Redshift-Leavitt bias for Cepheids and Miras with mean ⟨log Pobs⟩ = 2.4 whose LL is calibrated at log Prmref = 2.3, cf. Eqs. (6) and (7). |
| In the text | |
|
Fig. 4. Relative distance error as function of distance in case of cosmological redshift (considers only expansion). Relative distance errors of 1, 2, and 3% are shown by horizontal dotted lines. For Cepheids, we adopt b = −3.26 (corresponds to the H-band Period–Wesenheit relation using F160W, F555W, and F814W in R+16), for Miras b1 = −3.59, b2 = −3.40, and log Pref = 2.3 from Huang et al. (2018). If left uncorrected, RLB affects Cepheids at the 1% (2%) level for d > 62 Mpc (d > 123 Mpc). For Miras of mean log Pobs = 2.4, the 1% (2%) bias level is reached sooner, at d > 47.5 Mpc (d > 95 Mpc). |
| In the text | |
|
Fig. 5. Relative distance error incurred due to RLB, cf. Eq. (11). zobs was translated to distance assuming H0 = 74 km s−1 Mpc−1; scatter in the relation arises from peculiar velocities. The dark red solid, dashed, and dotted crosses indicate the average values obtained for different weightings. Solid lines: weighted according to σPL in Table 1, ⟨d0/dLL⟩ = 0.9972. Dashed lines: weighted according to NCep in Table 1. Dotted lines: unweighted mean distance and bias, ⟨d0/dLL⟩ = 0.9975. |
| In the text | |
Current usage metrics show cumulative count of Article Views (full-text article views including HTML views, PDF and ePub downloads, according to the available data) and Abstracts Views on Vision4Press platform.
Data correspond to usage on the plateform after 2015. The current usage metrics is available 48-96 hours after online publication and is updated daily on week days.
Initial download of the metrics may take a while.