Fig. 5
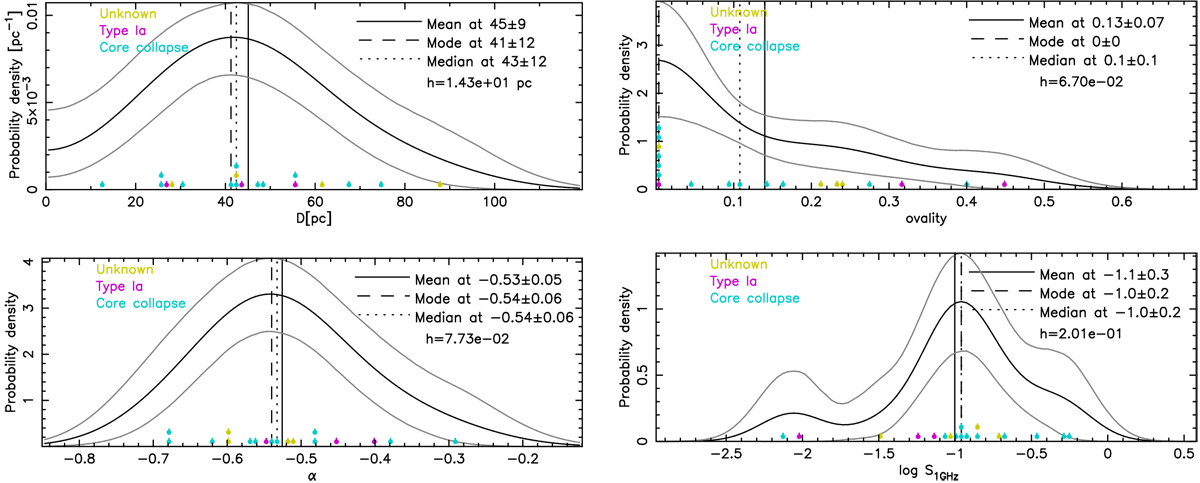
Distribution of parameters of 19 confirmed SMC SNRs using kernel smoothing. The colour of symbols indicate progenitor type for a particular SNR. Data points that fall in the same bin on the x-axis are plotted within a vertical column with equidistant spacing. The upper and lower grey curves delineate the 95% uncertainty level. The corresponding kernel bandwidth h and distribution parameters are shown on each panel. Top left: average diameter distribution. Top right: distribution of ovality, which is defined as 2 (Dmaj − Dmin)∕(Dmaj + Dmin), where Dmaj and Dmin are the major and minor axes, respectively. Bottom left: radio spectral index distribution. Bottom right: estimate of the 1 GHz flux density distribution for the 18 SNRs with available 1 GHz flux density estimates from Table A.1.
Current usage metrics show cumulative count of Article Views (full-text article views including HTML views, PDF and ePub downloads, according to the available data) and Abstracts Views on Vision4Press platform.
Data correspond to usage on the plateform after 2015. The current usage metrics is available 48-96 hours after online publication and is updated daily on week days.
Initial download of the metrics may take a while.