Fig. 4
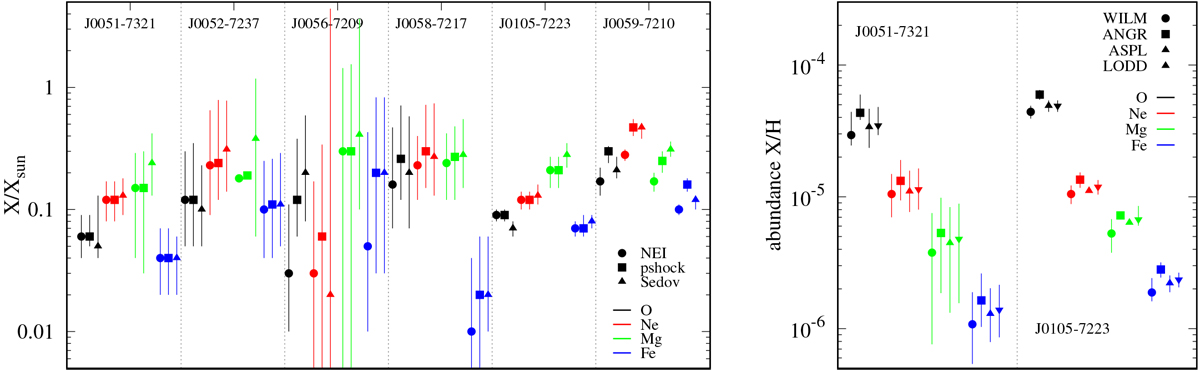
Comparison of the effect of type of spectral models (left) and input abundance tables (right) on abundance derived with X-ray spectra of SNRs. Left: O, Ne, Mg, and Fe abundances (by group of three, from left to right, respectively) relative to the reference value of Wilms et al. (2000), in five SMC SNRs (labelled on top). Different symbols are used for the three types of spectral models used. Right: for two SNRs, derived number abundances relative to hydrogen as function of input abundance tables (reference in Sect. 4.6), each coded by different symbols.
Current usage metrics show cumulative count of Article Views (full-text article views including HTML views, PDF and ePub downloads, according to the available data) and Abstracts Views on Vision4Press platform.
Data correspond to usage on the plateform after 2015. The current usage metrics is available 48-96 hours after online publication and is updated daily on week days.
Initial download of the metrics may take a while.