Fig. B.2
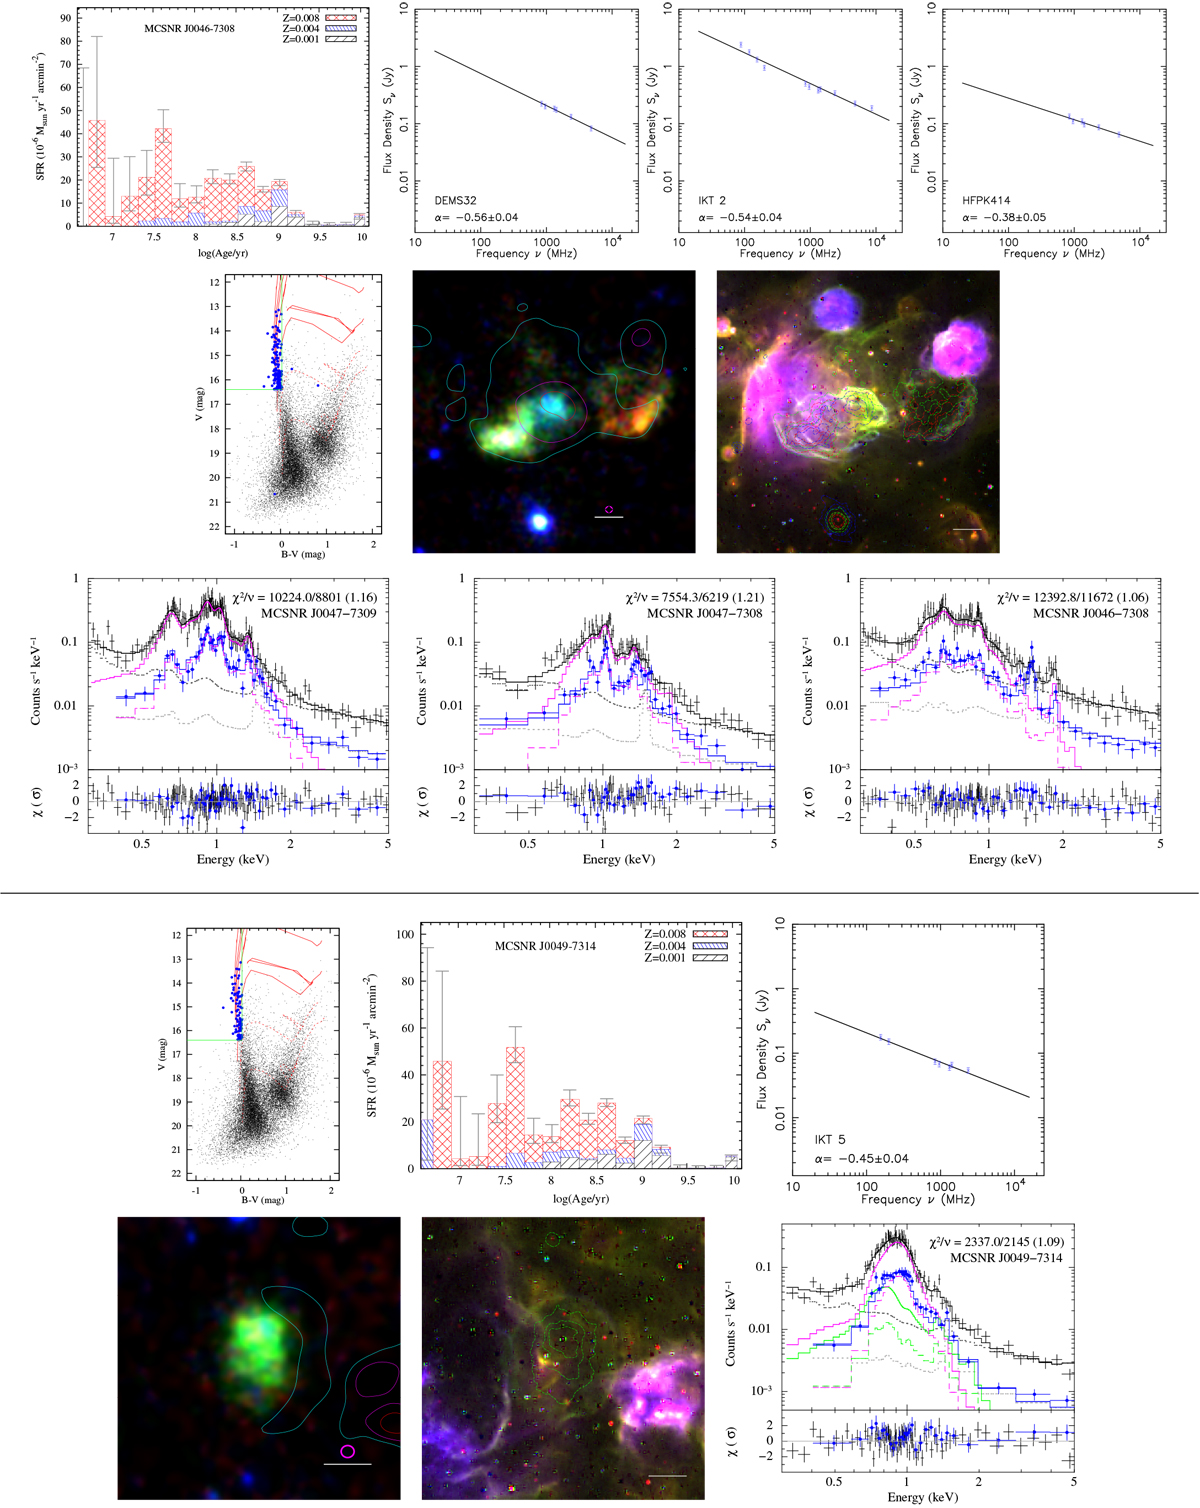
Top part: for the three SNRs in the N19 complex (Sect. 4.5.2) we show a single CMD and SFH as they are in the same photometric grid of Harris & Zaritsky (2004). The three SNRs are shown on the same images, with from left to right (decreasing RA) : MCNR J0047−7309, J0047−7308, J0046−7308; the radio and X-ray spectra are shown in the same order. The radio contour levels are at 1, 3, and 8 mJy beam−1. Bottom part: same as Fig. B.1 for MCSNR J0049−7314, with radio contour levels at 0.5, 1, and 2 mJy beam−1.
Current usage metrics show cumulative count of Article Views (full-text article views including HTML views, PDF and ePub downloads, according to the available data) and Abstracts Views on Vision4Press platform.
Data correspond to usage on the plateform after 2015. The current usage metrics is available 48-96 hours after online publication and is updated daily on week days.
Initial download of the metrics may take a while.