Fig. 14.
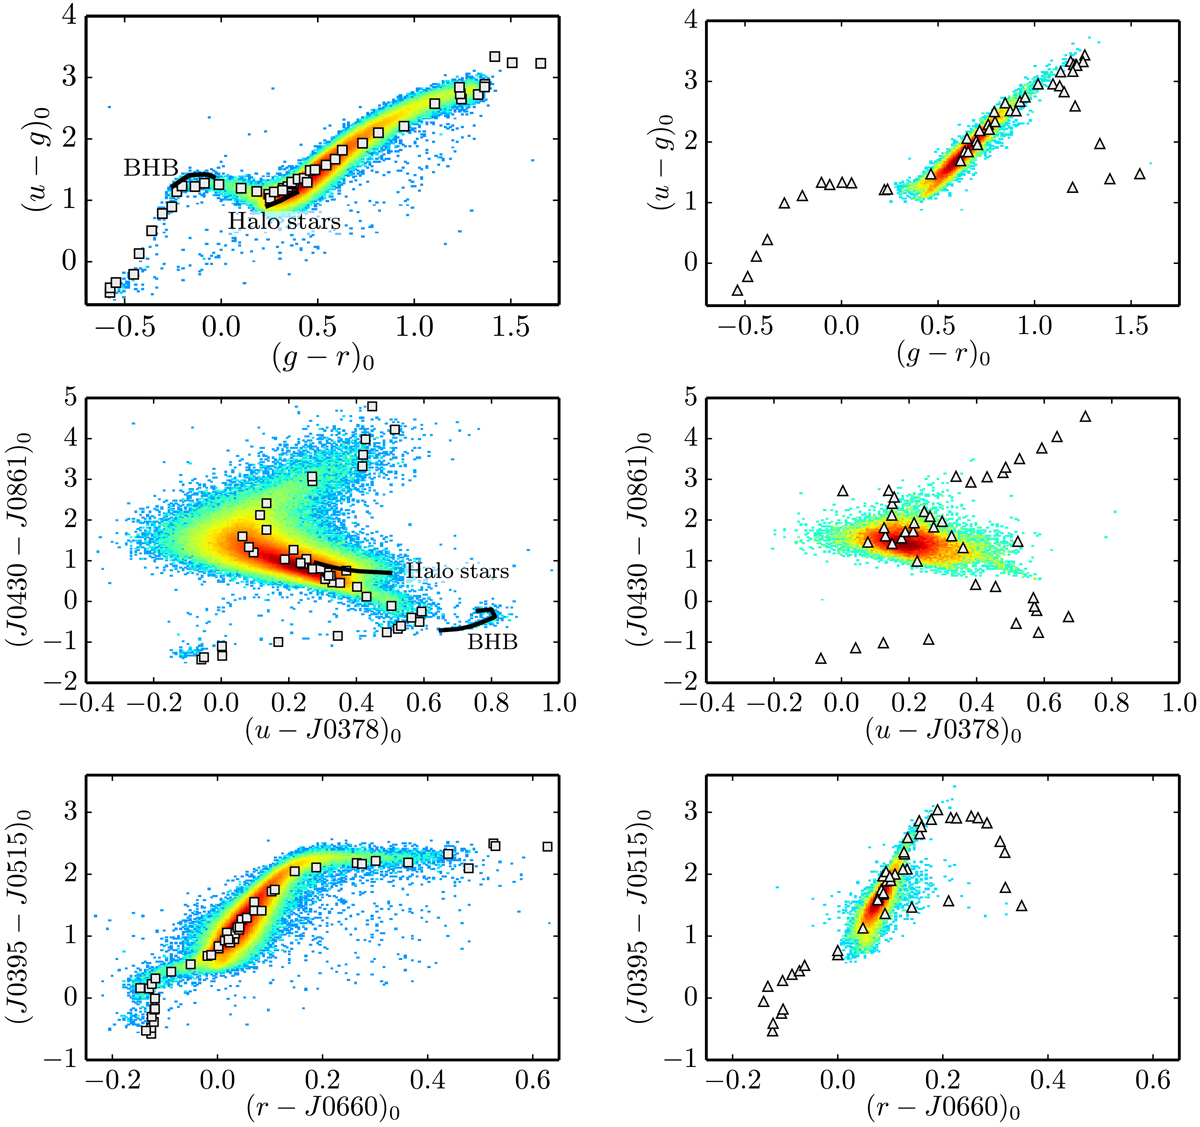
Dust de-reddened J-PLUS colour–colour diagrams of MS (left panels) and GB stars (right panels). From top to bottom: (u − g)0 vs. (g − r)0; (J0430 − J0861)0 vs. (u − J0378)0; (J0395 − J0515)0 vs. (r − J0660)0. The colour scale shows the density of sources, increasing from blue to red. The J-PLUS colours from the synthetic photometry of the Pickles (1998) empirical library are shown as grey symbols (squares for luminosity class V and triangles for luminosity class III). The location of low-metallicity halo stars and blue horizontal branch (BHB) stars is marked with a black line in the upper and middle left panels.
Current usage metrics show cumulative count of Article Views (full-text article views including HTML views, PDF and ePub downloads, according to the available data) and Abstracts Views on Vision4Press platform.
Data correspond to usage on the plateform after 2015. The current usage metrics is available 48-96 hours after online publication and is updated daily on week days.
Initial download of the metrics may take a while.