Fig. 1.
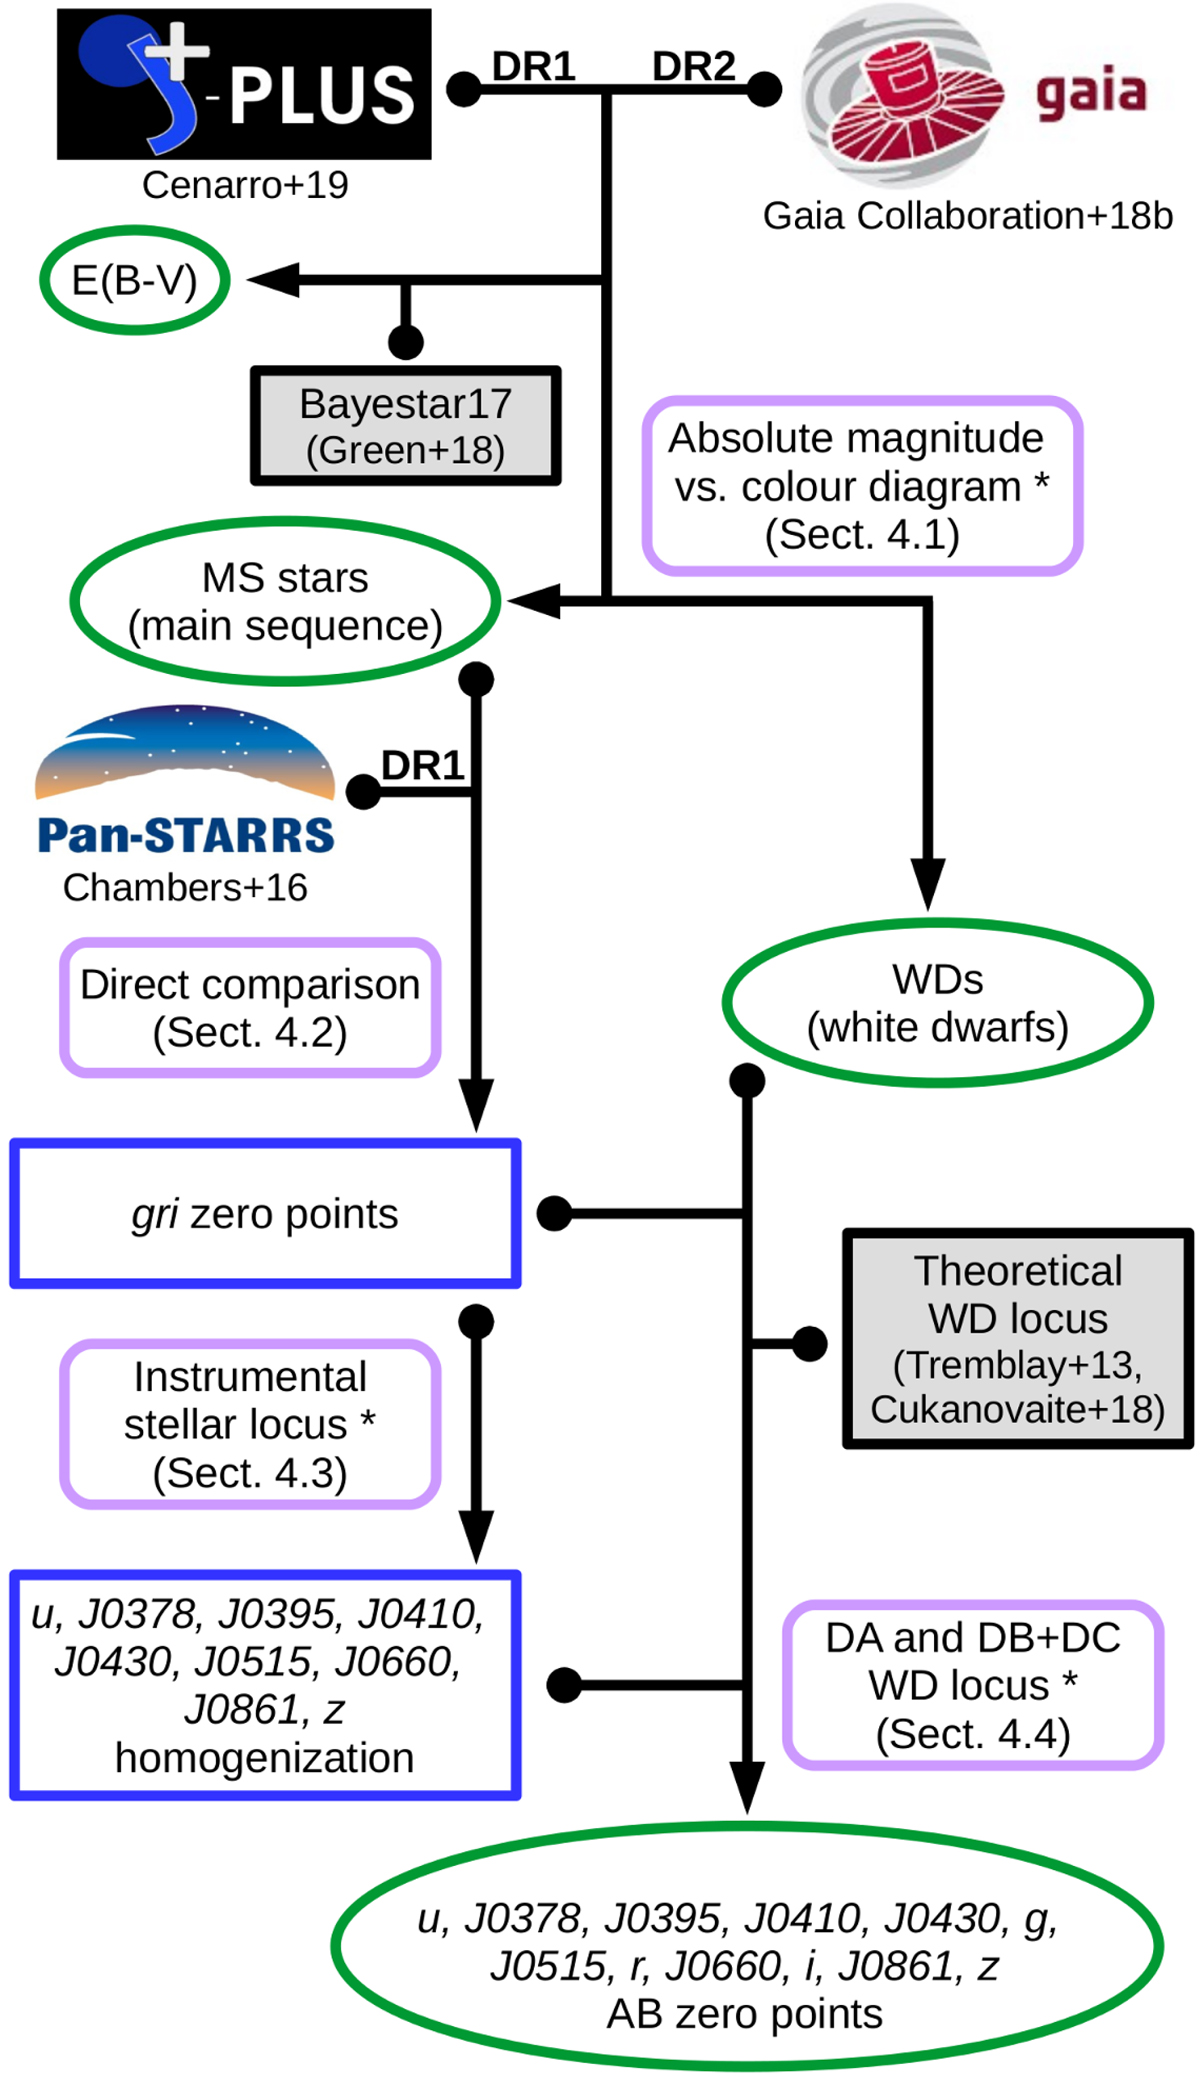
Flowchart of the calibration method presented in this work. Arrows that originate in small dots indicate that the preceding data product is an input to the subsequent analysis. Datasets are shown with their project logo, and external codes or models with grey boxes. The rounded-shape boxes show the calibration steps. The asterisks indicate those steps based on dust de-reddened magnitudes. The white boxes show intermediate data products, and ovals highlight publicly available data products of the calibration process.
Current usage metrics show cumulative count of Article Views (full-text article views including HTML views, PDF and ePub downloads, according to the available data) and Abstracts Views on Vision4Press platform.
Data correspond to usage on the plateform after 2015. The current usage metrics is available 48-96 hours after online publication and is updated daily on week days.
Initial download of the metrics may take a while.