Fig. 2
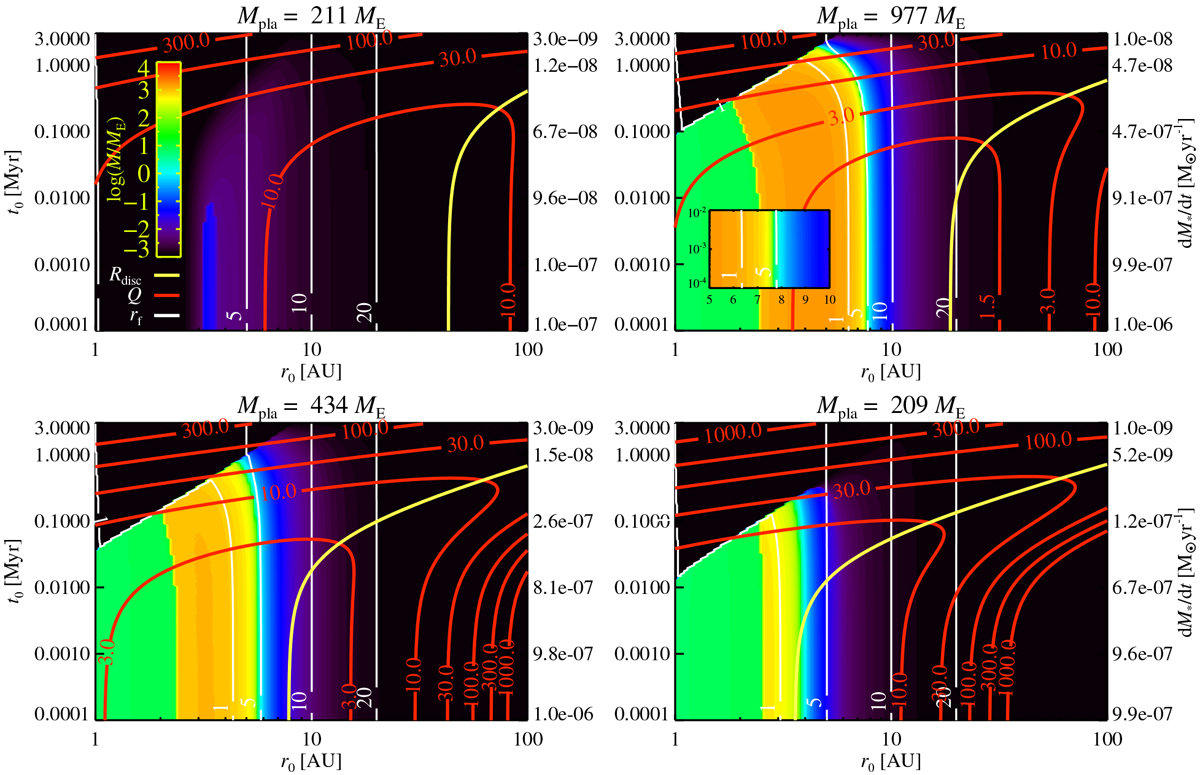
Growth maps for protoplanet growth by planetesimal accretion, with gas accretion commencing after 10 ME is reached. The maps show the final mass (i.e. the mass reached when the disc has dissipated after 3 Myr) as continuous colours and the final positions as white contour lines as a function of the starting position of the protoplanet and the starting time. We additionally show the size of the protoplanetary disc (yellow line) and the Toomre Q of the gas (red contour lines). The panels show the results for four values of the initial mass accretion rate through the disc and the mass accretion rate after 3 Myr. The instantaneous stellar mass accretion rate is shown on the right axis. Each panel is also labelled with the total mass of the planetesimals in the models; we assume here that 1% of the initial gas surface density profile is converted into planetesimals at t = 0. The nominal model (upper left) achieves protoplanet growth only up to 0.1 ME, approximately the mass of Mars. The three other models, where planetesimals form at the gravitationally unstable phase of protoplanetary disc evolution, successfully form hot and warm gas giants interior of 2 AU, but are not able to form any cold gasgiants in the 5–10 AU region (see inset in the upper right panel).
Current usage metrics show cumulative count of Article Views (full-text article views including HTML views, PDF and ePub downloads, according to the available data) and Abstracts Views on Vision4Press platform.
Data correspond to usage on the plateform after 2015. The current usage metrics is available 48-96 hours after online publication and is updated daily on week days.
Initial download of the metrics may take a while.