Fig. 3
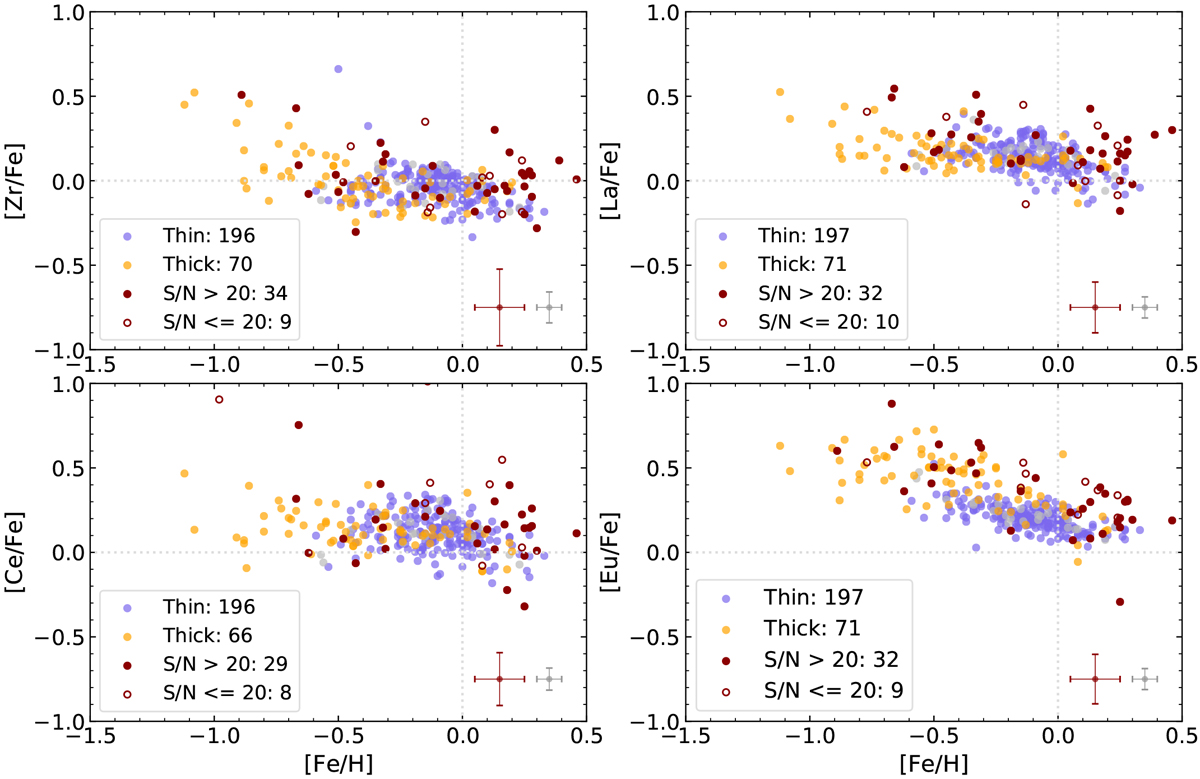
Abundance ratio trends with metallicity, [X/Fe] against [Fe/H], for the thin- (blue) and thick-disk (yellow) stars as well as the bulge stars (red). Since it was not possible to determine all abundances in all spectra, the number of stars in each sample is included in the legend. Filled dark red circles indicate bulge stars with a S/N above 20, whereas the hollow red circles indicate a S/N equal to or less than 20. Some of the disk stars could not be classified as thick or thin disk stars; these are marked as grey dots. The typical uncertainty for the disk and the bulge sample, as described in Sect. 4.2, is marked in the lower right corner of every plot.
Current usage metrics show cumulative count of Article Views (full-text article views including HTML views, PDF and ePub downloads, according to the available data) and Abstracts Views on Vision4Press platform.
Data correspond to usage on the plateform after 2015. The current usage metrics is available 48-96 hours after online publication and is updated daily on week days.
Initial download of the metrics may take a while.