Fig. 2
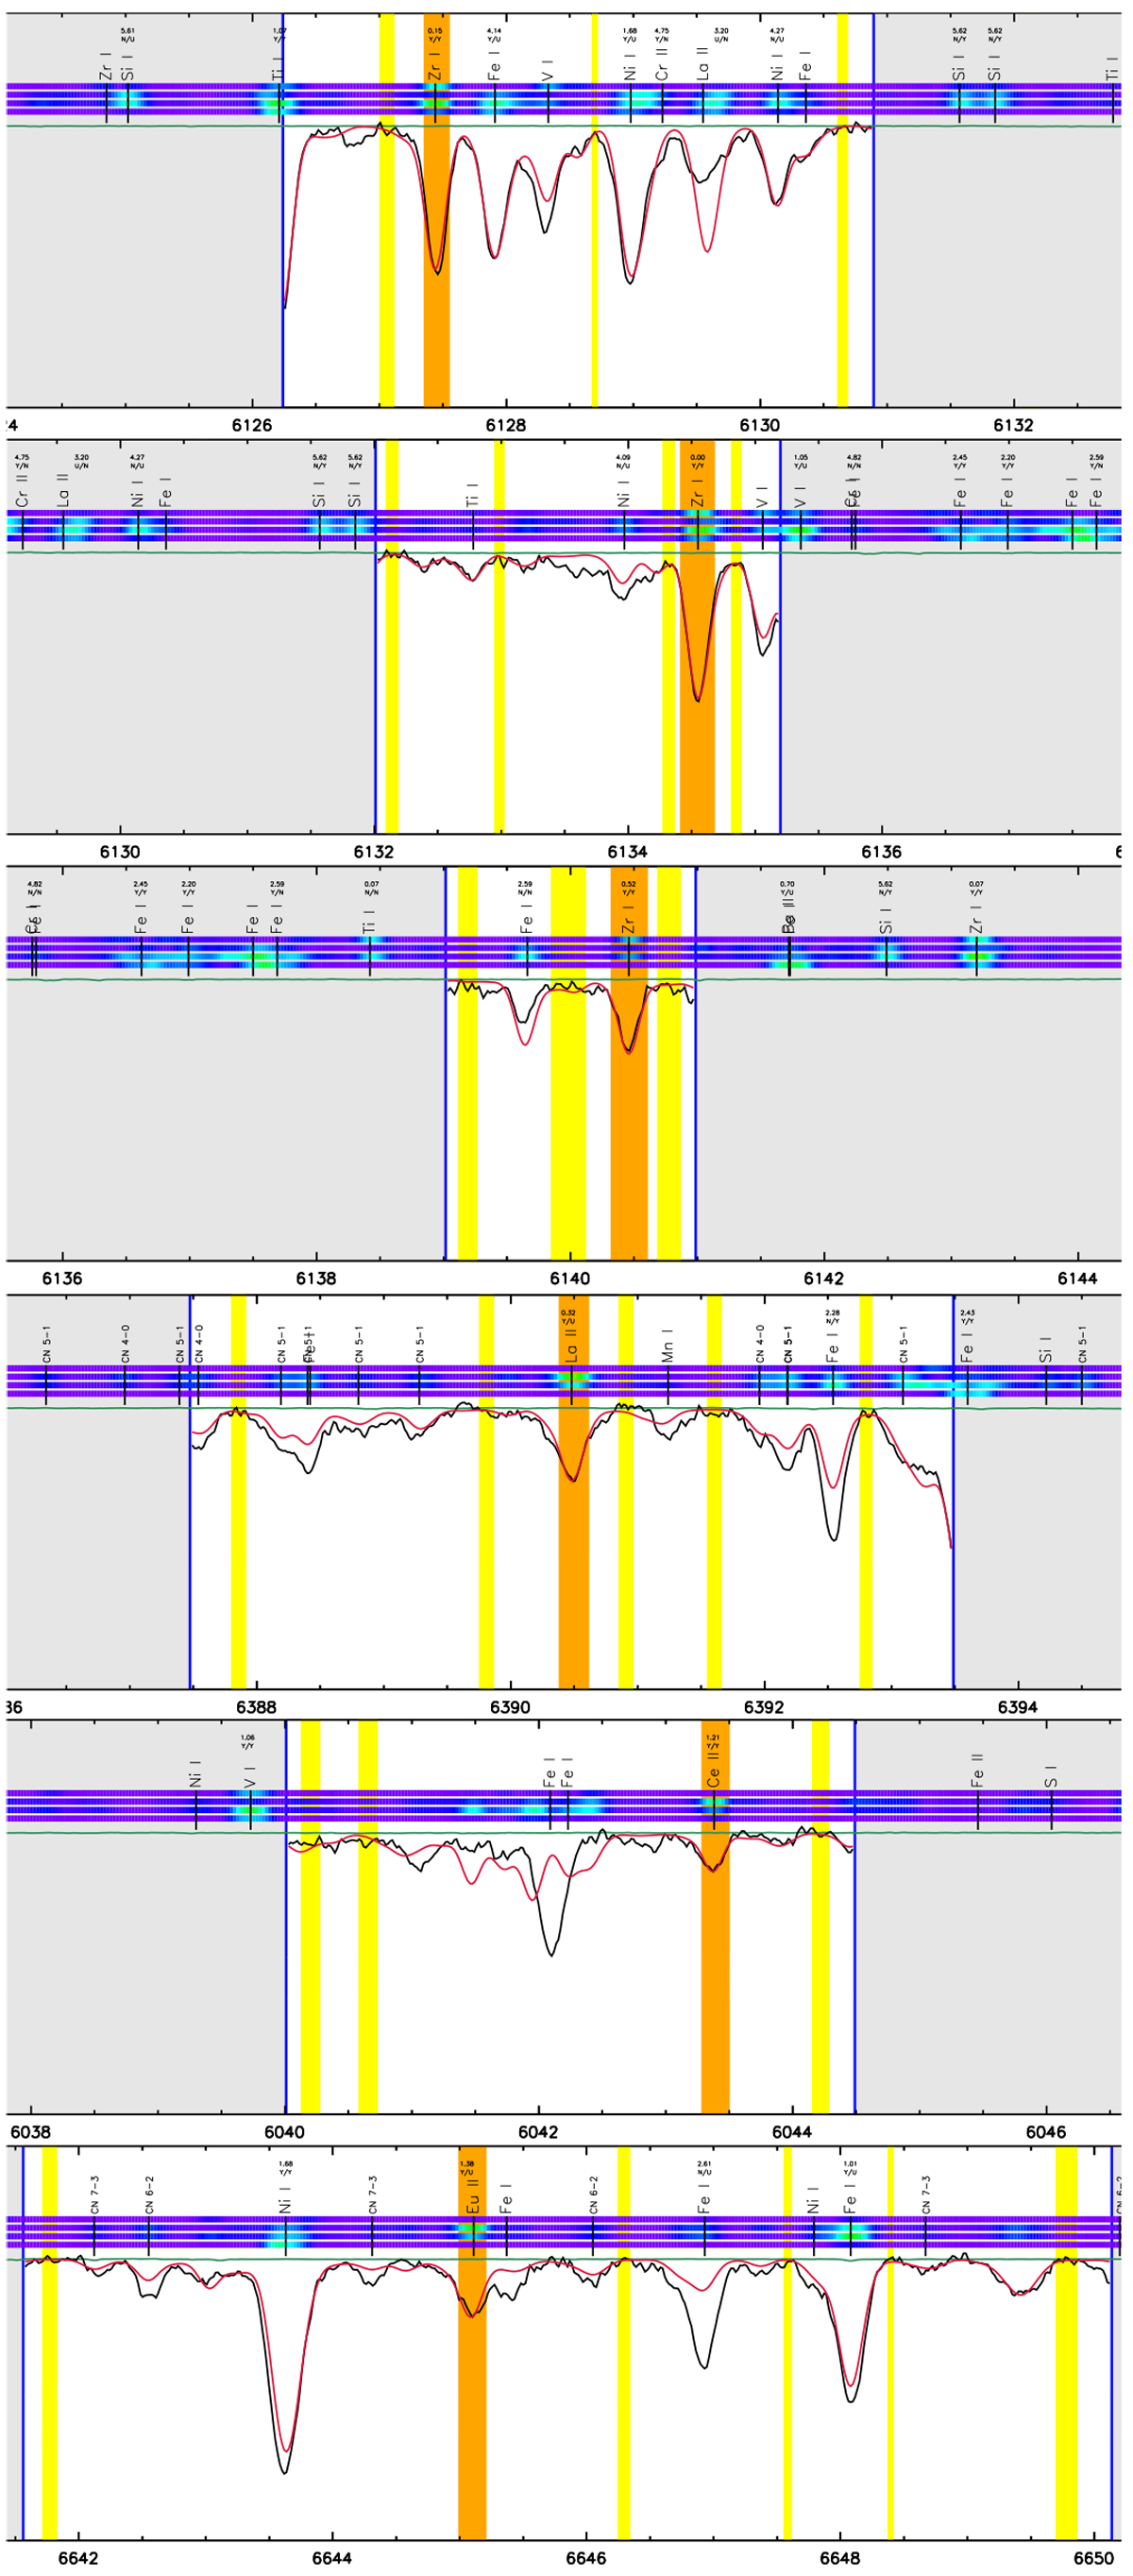
Observed spectrum (black) of the bulge star B6-F1 (S/N = 54). The lines for abundance determination of Zr (three lines), La, Ce, and Eu (one line each) are marked out as the orange regions. The yellow regions are the manually placed continuum and the red spectrum is the synthetic one. The segments within which the synthetic spectrum is modelled are marked as the white wavelength regions between the blue vertical lines in each panel. The four horizontal lines above each spectrum indicate the lines’ sensitivity in the stellar parameters Teff, log g, [Fe/H] and ξmicro, respectively, where green is more sensitive than blue.
Current usage metrics show cumulative count of Article Views (full-text article views including HTML views, PDF and ePub downloads, according to the available data) and Abstracts Views on Vision4Press platform.
Data correspond to usage on the plateform after 2015. The current usage metrics is available 48-96 hours after online publication and is updated daily on week days.
Initial download of the metrics may take a while.