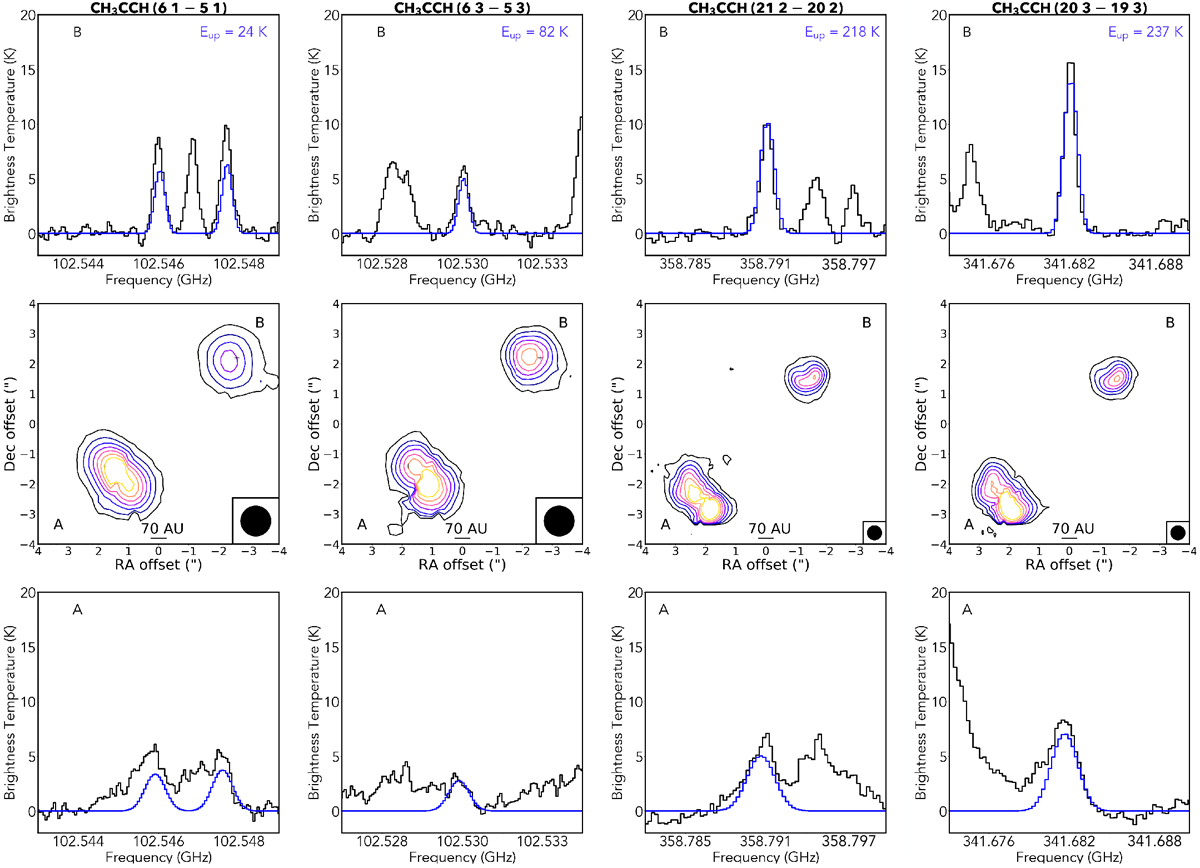
Fig. 2

VINE emission maps and spectra of the four brightest CH3CCH lines detected in the Band 3 and Band 7 datasets. The panels are arranged in order of increasing upper energy level. Top panels: spectra of the lines (black line) and LTE best fit model (blue line) towards IRAS 16293B. Bottom panels: same towards IRAS 16293A. Middle panels: velocity-integrated emission map (VINE) map of the emission towards each source. The velocity interval used is 3.2 and 1.2 km s−1 for IRAS 16293A and IRAS 16293B, respectively. The contours range from 10–90% of the maximum flux in each plot in steps of 10%. This corresponds to 8σ–63σ, 5σ–40σ, 18σ–144σ, and 20σ–167σ for each of the middle panels. The RA and Dec coordinates are given relative to the phase centre of the observations, which is the same in both the Band 3 and Band 7 datasets. The shift in position of both sources between the two datasets is to be expected, due to the difference in time between the observations, and has been discussed previously (e.g. Pech et al. 2010). The upper energy level of each transition is given in the top right corner of the top panels. The beam size of the observations is given in the bottom right corner of the middle panels.
Current usage metrics show cumulative count of Article Views (full-text article views including HTML views, PDF and ePub downloads, according to the available data) and Abstracts Views on Vision4Press platform.
Data correspond to usage on the plateform after 2015. The current usage metrics is available 48-96 hours after online publication and is updated daily on week days.
Initial download of the metrics may take a while.


