Fig. 5.
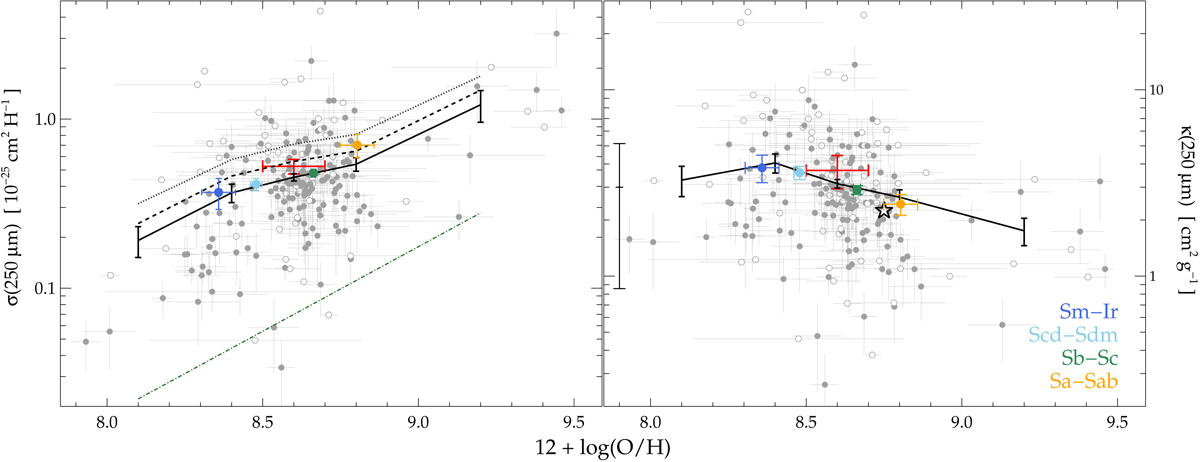
Absorption cross section per H atom σ(250 μm) (left panel) and per dust mass κ(250 μm) (right panel) as a function of the metallicity. The two panels show individual measurements as grey dots, with the same convention for open and filled symbols as in Fig. 2. The mean (and its standard deviation) of the quantity of the y-axis for the five metallicity bins defined in Fig. 3 (black error bars connected by a solid line) is shown, and the same, but for the four morphology bins (coloured dots with error bars). We also plot the HeViCS MW estimate of Table 1 (red error bars). Left panel: we also show the mean for each metallicity bin, when the dust temperature is derived with β = 1.8 (dashed line) and 2.0 (dotted line), and the slope for a linear dependence of κ(250 μm) on O/H (green dot-dashed line, arbitrary scale; Eqs. (4) and (5)). Right panel: the black error bar at the left shows the uncertainty in ((D/H)/(O/H))MW. The star indicates the value derived from C16 after rescaling it to the assumptions of this work (see text for details).
Current usage metrics show cumulative count of Article Views (full-text article views including HTML views, PDF and ePub downloads, according to the available data) and Abstracts Views on Vision4Press platform.
Data correspond to usage on the plateform after 2015. The current usage metrics is available 48-96 hours after online publication and is updated daily on week days.
Initial download of the metrics may take a while.