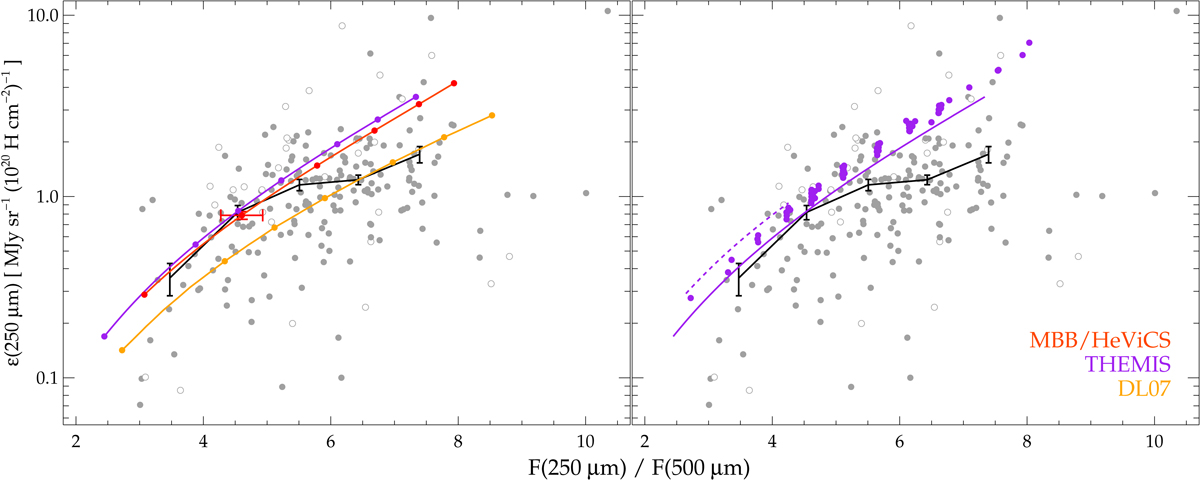
Fig. 4.

Same as Fig. 2 (individual error bars are omitted for clarity). Left panel: the red line shows the locus of an MBB with β = 1.6 for different temperatures (red dots along the line give the values at Td = 15, 20, 25, 30, 35, and 40 K, from left to right). The purple and orange lines show the loci of dust heated by the LISRF scaled by a factor U for the THEMIS and DL07 grain models, respectively (dots along the lines are for U = 0.1, 0.5, 1, 2, 5, 10, and 20, from left to right). Right panel: the THEMIS dust model (solid purple line) is repeated together with the CMM model from Köhler et al. (2015) for 0.1 < U < 0.5 (dashed purple line). Purple dots are the emissivity values estimated from the CIGALE-THEMIS best-fit SEDs of each galaxy (see text for details).
Current usage metrics show cumulative count of Article Views (full-text article views including HTML views, PDF and ePub downloads, according to the available data) and Abstracts Views on Vision4Press platform.
Data correspond to usage on the plateform after 2015. The current usage metrics is available 48-96 hours after online publication and is updated daily on week days.
Initial download of the metrics may take a while.


