Fig. 3.
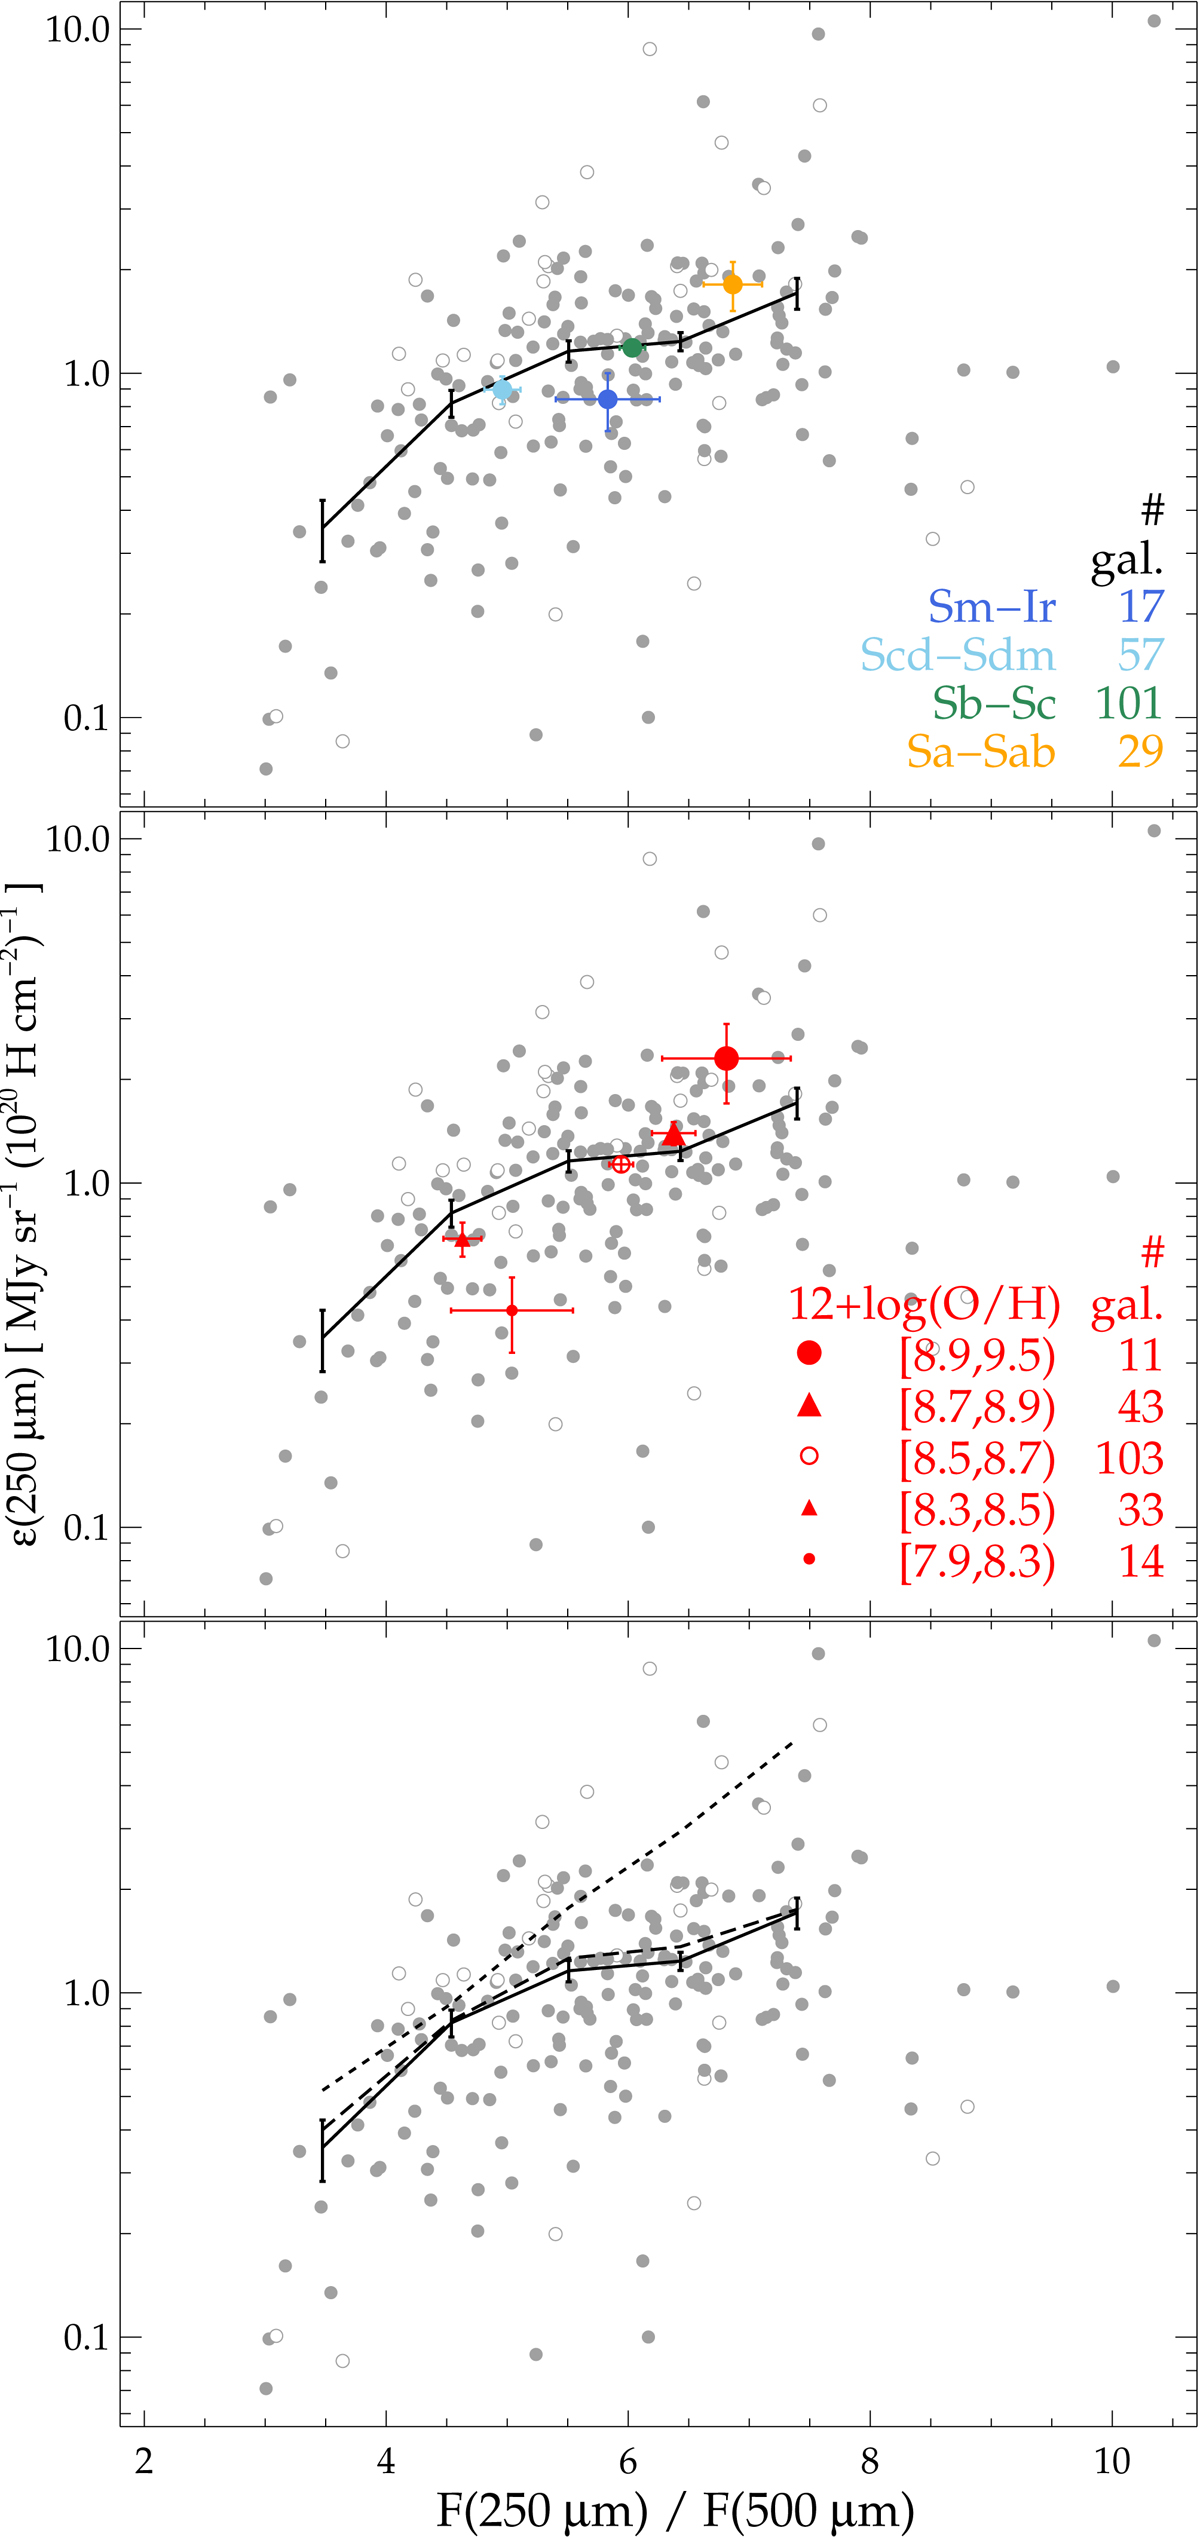
Emissivity ϵ(250 μm) as a function of F(250 μm)/F(500 μm) for each galaxy (grey datapoints) and for the mean for F(250 μm)/ F(500 μm) bins (same as Fig. 2, but individual error bars are omitted for clarity). Coloured dots in the top panel show the mean and its standard deviation for bins of different morphological types. Red dots in the central panel show the same, but for bins in metallicity (the number of objects for each bin is given in both panels). Bottom panel: the long-dashed line shows the binned mean assuming a constant CO-to-H2 conversion factor, and the short-dashed line shows the mean when the H2 component is neglected.
Current usage metrics show cumulative count of Article Views (full-text article views including HTML views, PDF and ePub downloads, according to the available data) and Abstracts Views on Vision4Press platform.
Data correspond to usage on the plateform after 2015. The current usage metrics is available 48-96 hours after online publication and is updated daily on week days.
Initial download of the metrics may take a while.