Fig. 2.
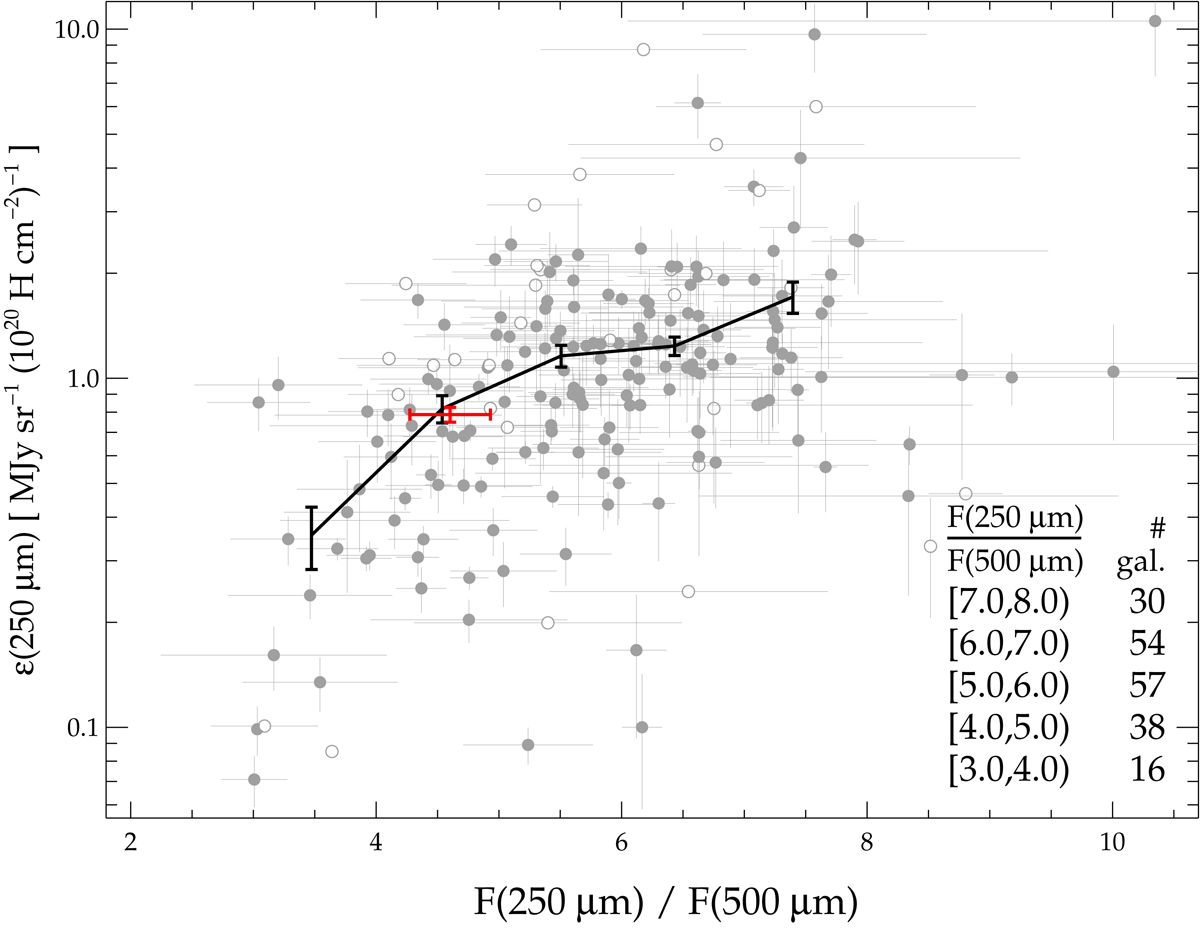
Emissivity ϵ(250 μm) as a function of the F(250 μm)/F(500 μm) ratio. When data on the abscissa (and/or ordinate) are estimated at a level below 2σ, the x (and/or y) error is omitted and an open symbol is used. The red error bar shows the MW estimate from HeVICS. The mean of ϵ(250 μm) and its standard deviation for five bins in F(250 μm)/F(500 μm) is shown by the black error bars (connected by a solid line). The F(250 μm)/F(500 μm) range and the number of galaxies is given for each bin.
Current usage metrics show cumulative count of Article Views (full-text article views including HTML views, PDF and ePub downloads, according to the available data) and Abstracts Views on Vision4Press platform.
Data correspond to usage on the plateform after 2015. The current usage metrics is available 48-96 hours after online publication and is updated daily on week days.
Initial download of the metrics may take a while.