Fig. 3.
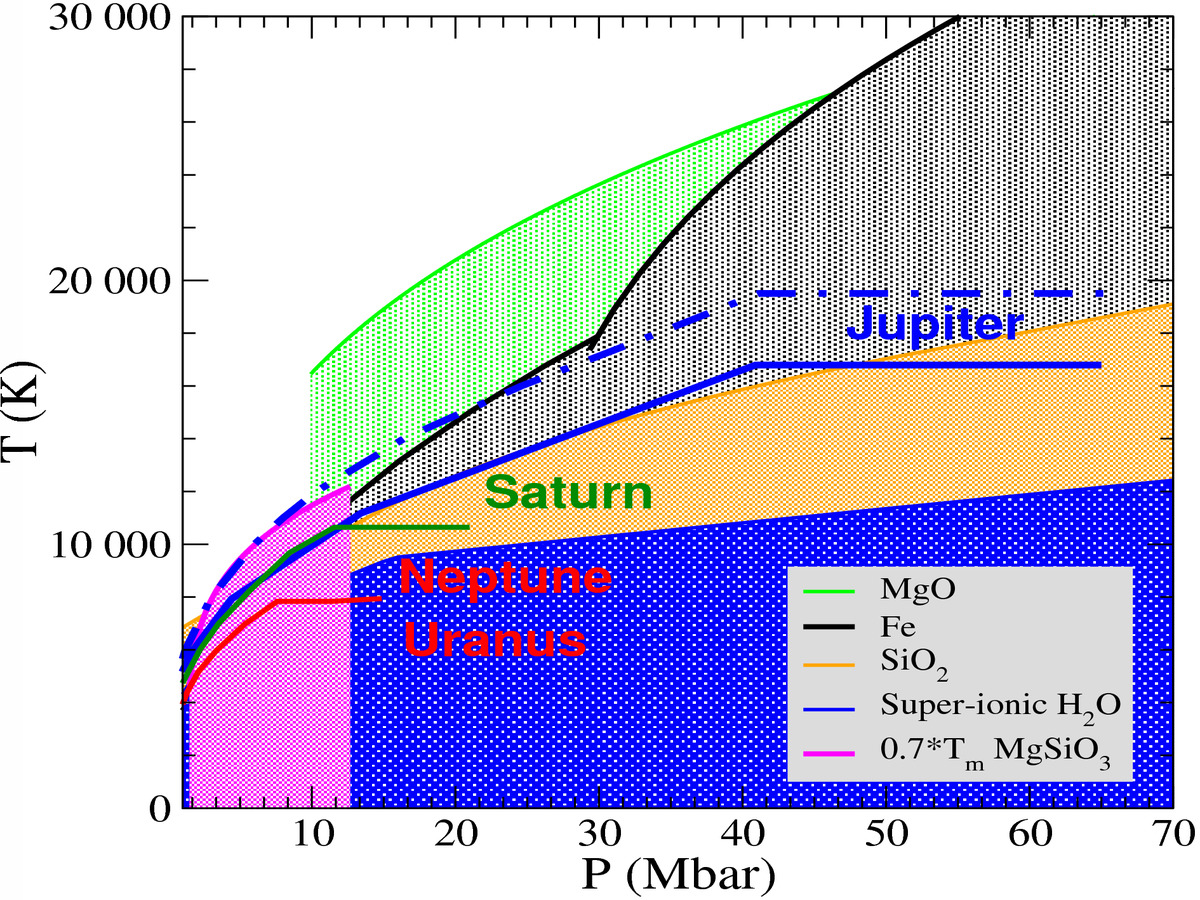
Comparison between the high-pressure melting temperatures we obtained and density-temperature profiles for the planets of the solar system (red lines). The dashed regions correspond to P–T conditions where the constituent is in a solid state. The adiabats for Saturn, Neptune, and Uranus are from Guillot & Gautier (2014). For Jupiter, we show the adiabats obtained by Nettelmann et al. (2012; dashes) and Militzer & Hubbard (2013; solid).
Current usage metrics show cumulative count of Article Views (full-text article views including HTML views, PDF and ePub downloads, according to the available data) and Abstracts Views on Vision4Press platform.
Data correspond to usage on the plateform after 2015. The current usage metrics is available 48-96 hours after online publication and is updated daily on week days.
Initial download of the metrics may take a while.