Free Access
Fig. 1.
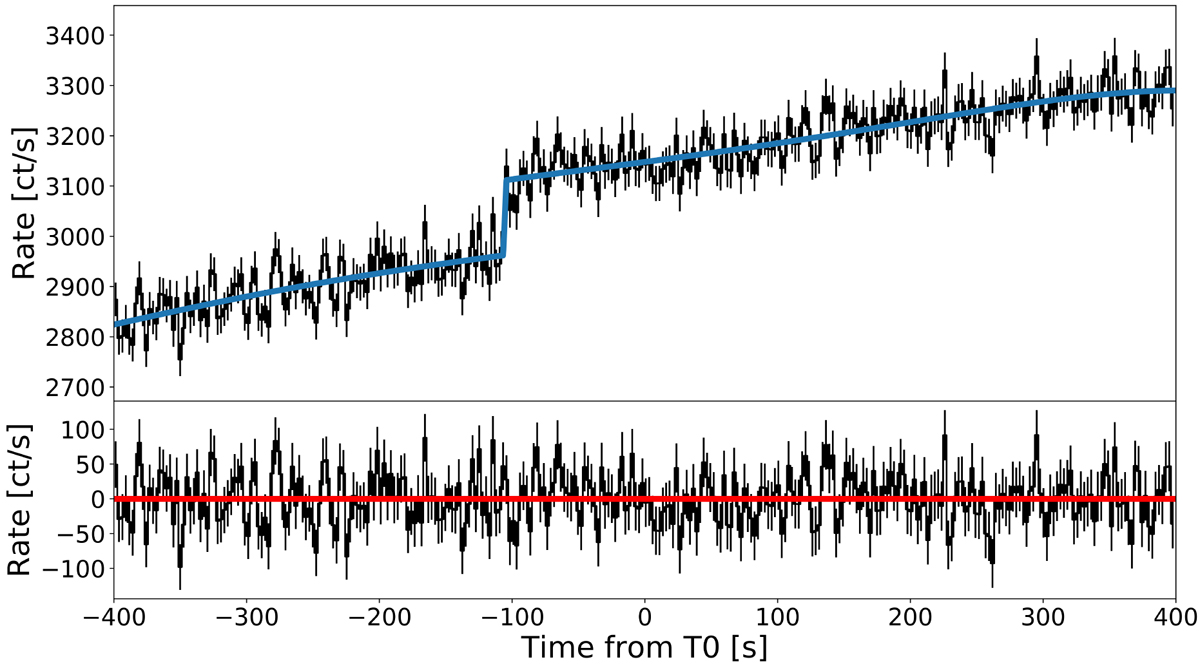
Example of step function fitting applied to a case of Sco X-1 occulation step that occurred ∼100 s before FRB 180727.J1311+26. Top panel: 8–1000 keV lightcurve along with the modelled background (solid line). Bottom panel: residuals of the background modelling.
Current usage metrics show cumulative count of Article Views (full-text article views including HTML views, PDF and ePub downloads, according to the available data) and Abstracts Views on Vision4Press platform.
Data correspond to usage on the plateform after 2015. The current usage metrics is available 48-96 hours after online publication and is updated daily on week days.
Initial download of the metrics may take a while.