Fig. 9
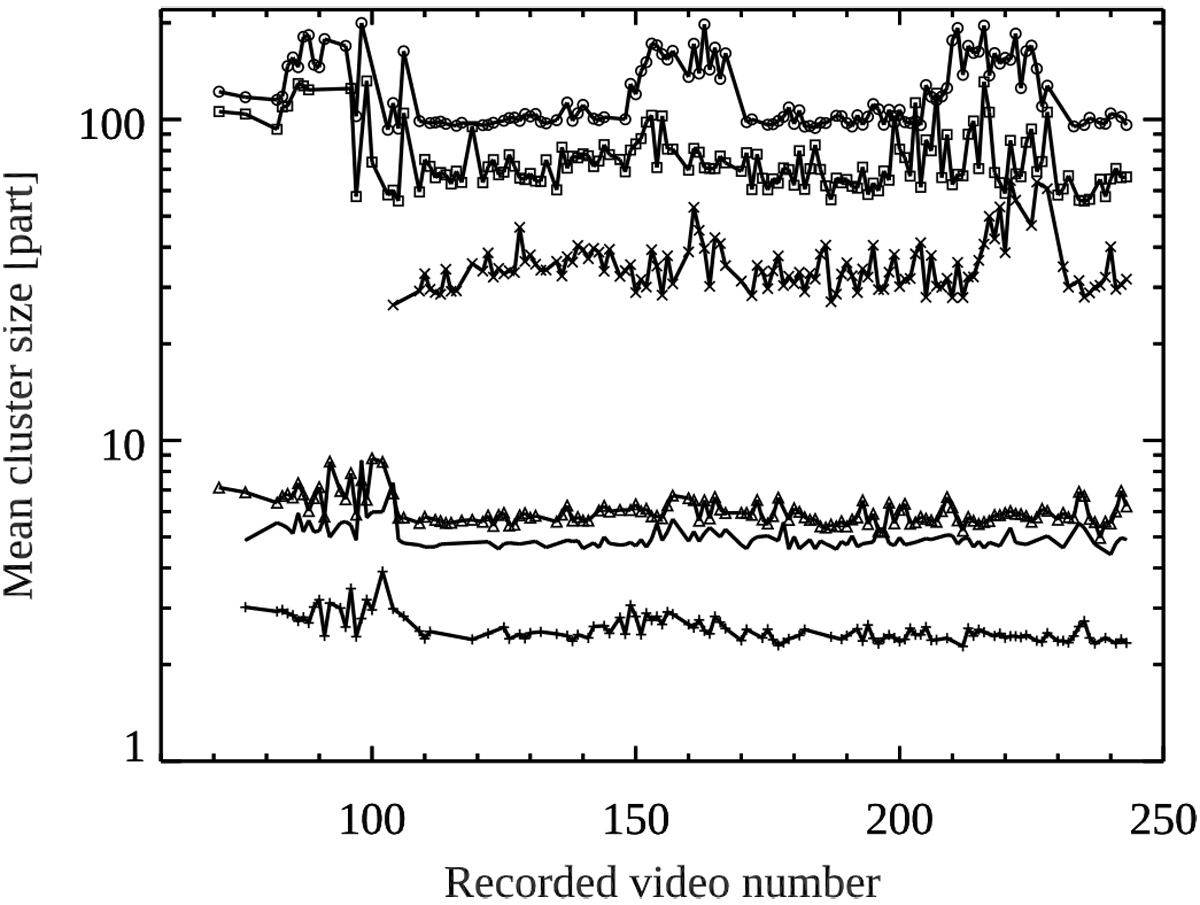
Long-term evolution of the average cluster size in each tray over the lifetime of the experiment. Each data point shows the cluster size after a shaking event and subsequent energy damping through multiple collisions leading to clustering. Dates span from November 2014 (left) to July 2015 (right). The video labels as shown (about 70–250) do not correspond to regular time intervals. No offset is used for the different trays. From bottom to top: tray 1 (plus signs), 3 (no symbols), 5 (triangles), 7 (cross sign), 6 (squares), and 8 (circles).
Current usage metrics show cumulative count of Article Views (full-text article views including HTML views, PDF and ePub downloads, according to the available data) and Abstracts Views on Vision4Press platform.
Data correspond to usage on the plateform after 2015. The current usage metrics is available 48-96 hours after online publication and is updated daily on week days.
Initial download of the metrics may take a while.