Fig. 8
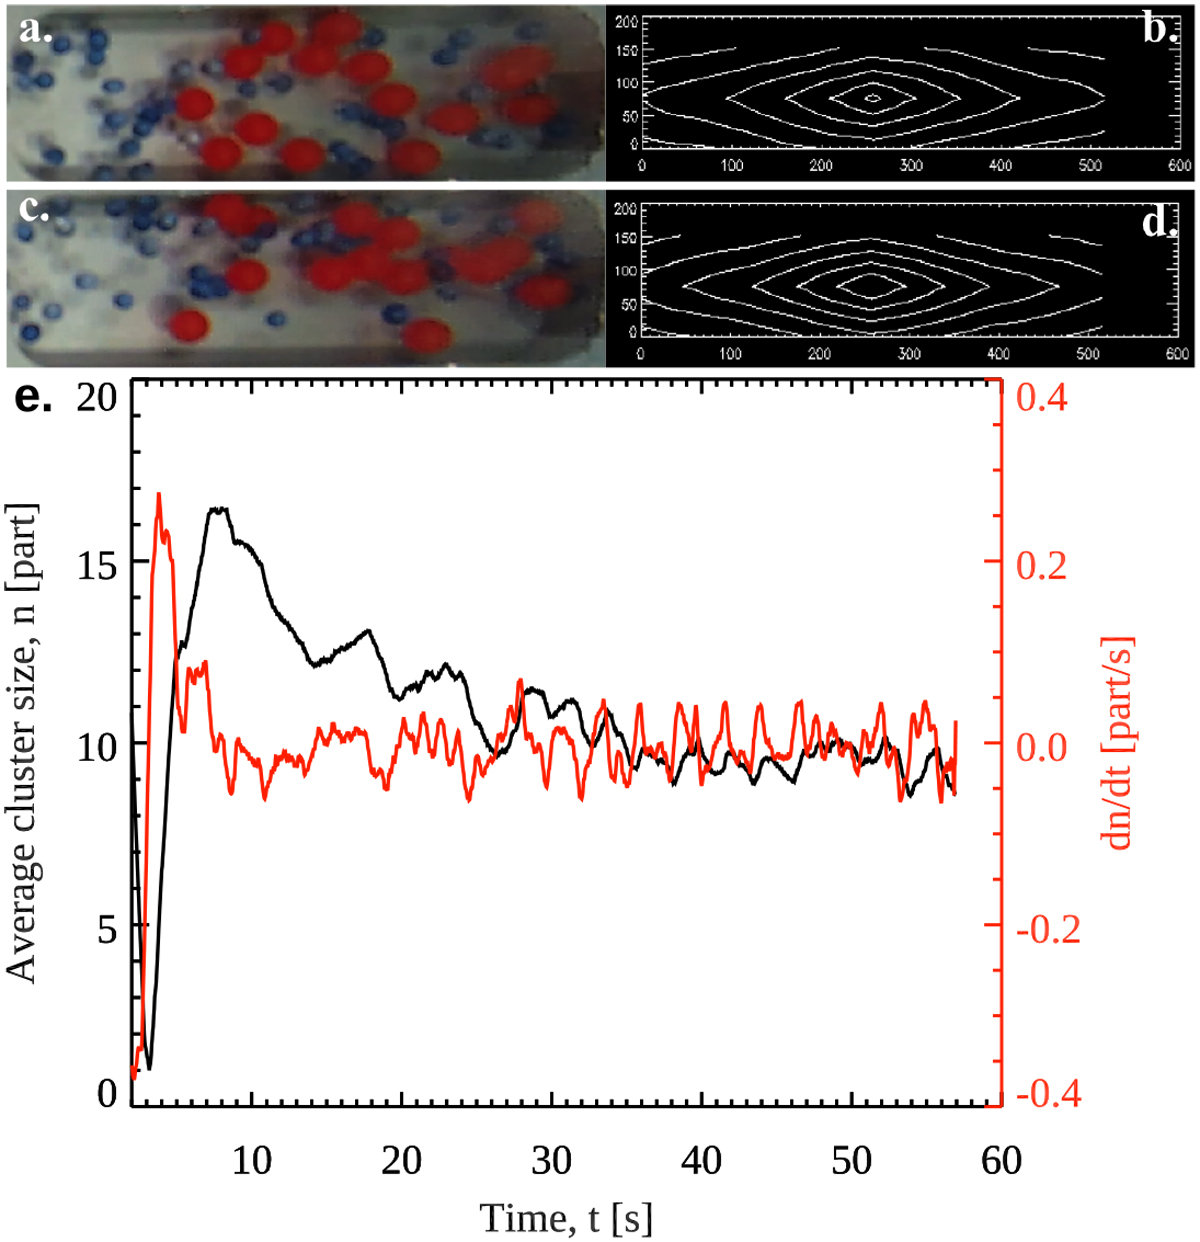
Example of the image autocorrelation performed on the NanoRocks data. During the shaking event, the particles in tray 3 (a) are colliding individually, bouncing off each other, while 20 s after the shaking event, very slow collisions between particles have led to the formation of clusters (c). Comparing the autocorrelation results of these two images, contoured using the same (arbitrary) levels (b and d, respectively), gives a quantitative information on the final cluster size. (e) Calibrated cluster size deduced from the measurement of the area enclosed in an arbitrary autocorrelation level during a NanoRocks shaking cycle (see text for details) in a recording of tray 3 containing 2-mm red acrylic and 1-mm blue glass beads (see Table 1). In red we show the derivative of the cluster size with time dn/dt, which can be used to detect the onset of clustering in the tray.
Current usage metrics show cumulative count of Article Views (full-text article views including HTML views, PDF and ePub downloads, according to the available data) and Abstracts Views on Vision4Press platform.
Data correspond to usage on the plateform after 2015. The current usage metrics is available 48-96 hours after online publication and is updated daily on week days.
Initial download of the metrics may take a while.