Fig. 7
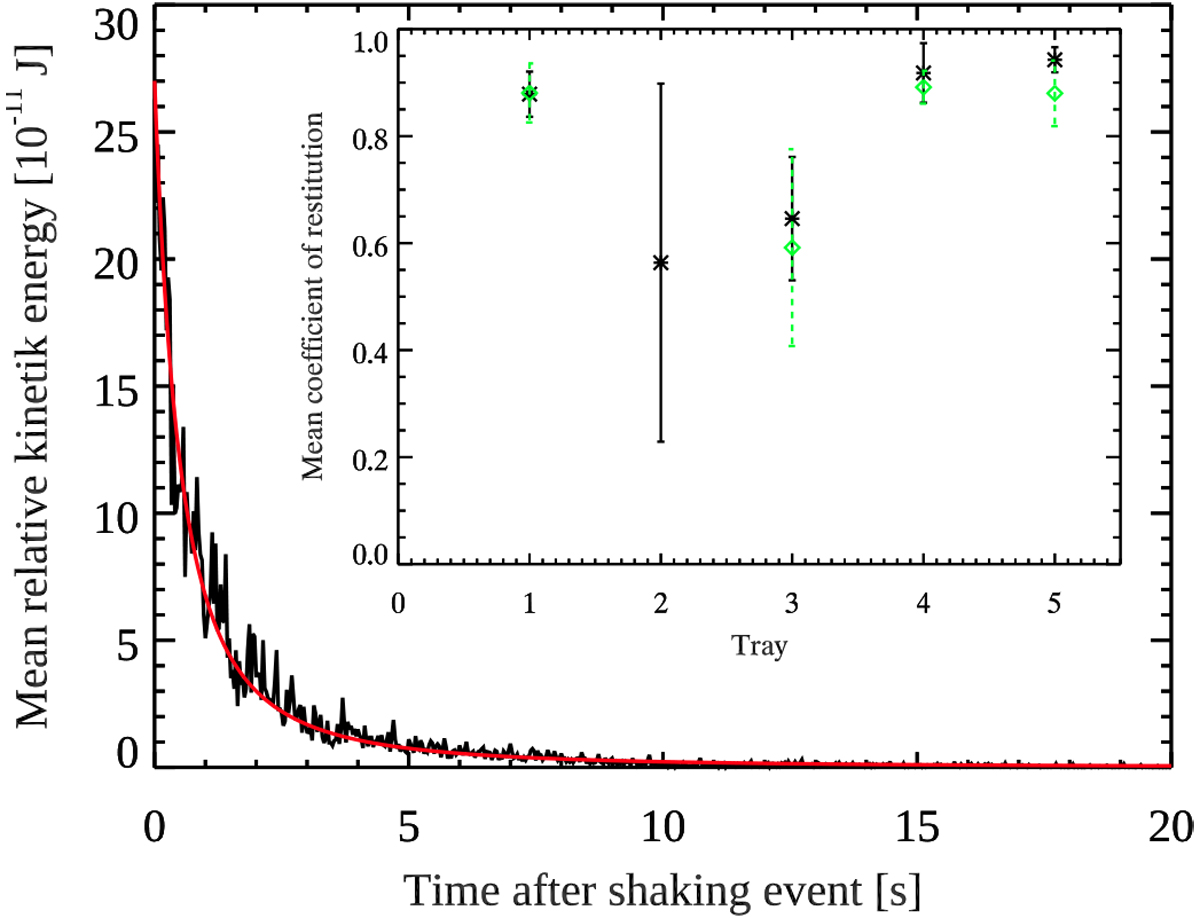
Mean relative kinetic energy in the NanoRocks tray 1 after a shaking event. The red curve shows the
![]() fit with the parameters T0 = 2.70 × 10⁻¹⁰ J and τ0 = 1.64 s. The computed mean coefficient of restitution for this shaking cycle is ɛ = 0.89. The inset shows the mean coefficient of restitution for each NanoRocks tray calculated using these fit parameters averaged over 178 shaking cycles (black asterisks, see Table 1 for a tray description). When possible, we also calculated the average coefficient of restitution using the same method based on the automated tracking data (green diamonds).
fit with the parameters T0 = 2.70 × 10⁻¹⁰ J and τ0 = 1.64 s. The computed mean coefficient of restitution for this shaking cycle is ɛ = 0.89. The inset shows the mean coefficient of restitution for each NanoRocks tray calculated using these fit parameters averaged over 178 shaking cycles (black asterisks, see Table 1 for a tray description). When possible, we also calculated the average coefficient of restitution using the same method based on the automated tracking data (green diamonds).
Current usage metrics show cumulative count of Article Views (full-text article views including HTML views, PDF and ePub downloads, according to the available data) and Abstracts Views on Vision4Press platform.
Data correspond to usage on the plateform after 2015. The current usage metrics is available 48-96 hours after online publication and is updated daily on week days.
Initial download of the metrics may take a while.