Fig. 6
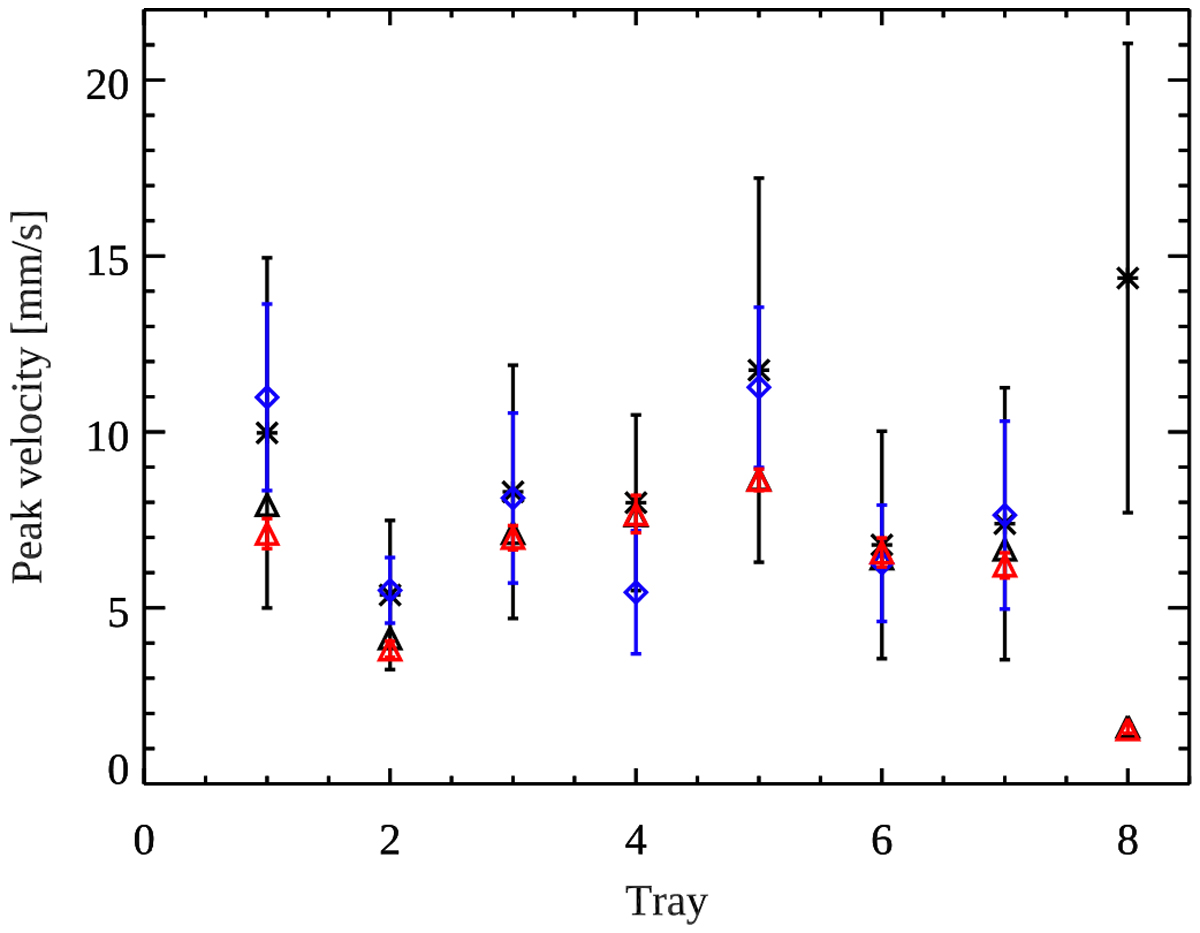
Peak velocity inside the NanoRocks trays: measured manually for one shaking cycle (averaged over 10 particles, black asterisks); computed via the automated tracking (averaged over all tracks, blue diamonds); and with the statistical method described in the text (triangles). The velocity values determined statistically are shown for the data set that was also tracked manually (black triangles), and averaged over 178 shaking cycles (red triangles with the mean absolute deviation shown as error bars (red). Red and black triangles overlap for most trays.
Current usage metrics show cumulative count of Article Views (full-text article views including HTML views, PDF and ePub downloads, according to the available data) and Abstracts Views on Vision4Press platform.
Data correspond to usage on the plateform after 2015. The current usage metrics is available 48-96 hours after online publication and is updated daily on week days.
Initial download of the metrics may take a while.