Fig. 4
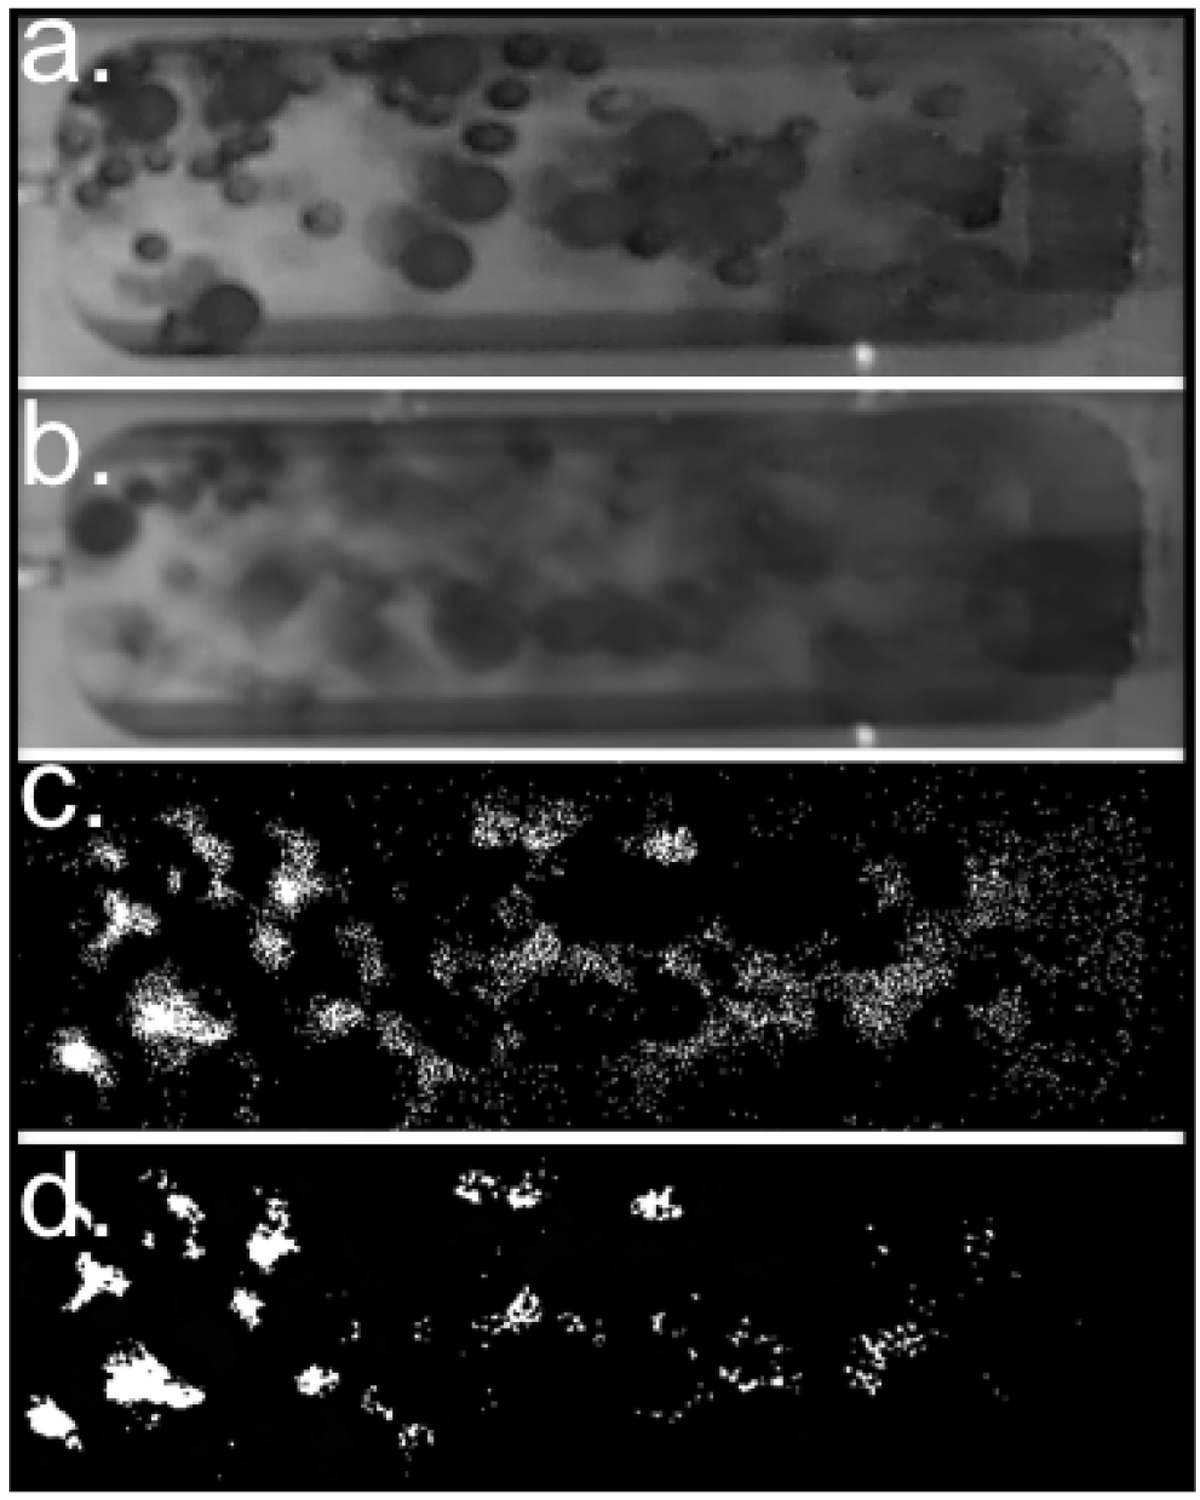
Processing of the NanoRocks data frames for statistical data analysis. (a) The gray frame consists of a mixture of the three(red, green and blue) layers of the original frame, chosen to distinctly reveal the red and blue beads. (b) This averaged frame is produced by averaging 10 consecutive gray frames. (c) The next step consists in subtracting each frame from its following frame. (d) Finally, the subtracted frame gets despeckled and binarized.
Current usage metrics show cumulative count of Article Views (full-text article views including HTML views, PDF and ePub downloads, according to the available data) and Abstracts Views on Vision4Press platform.
Data correspond to usage on the plateform after 2015. The current usage metrics is available 48-96 hours after online publication and is updated daily on week days.
Initial download of the metrics may take a while.