Fig. 3
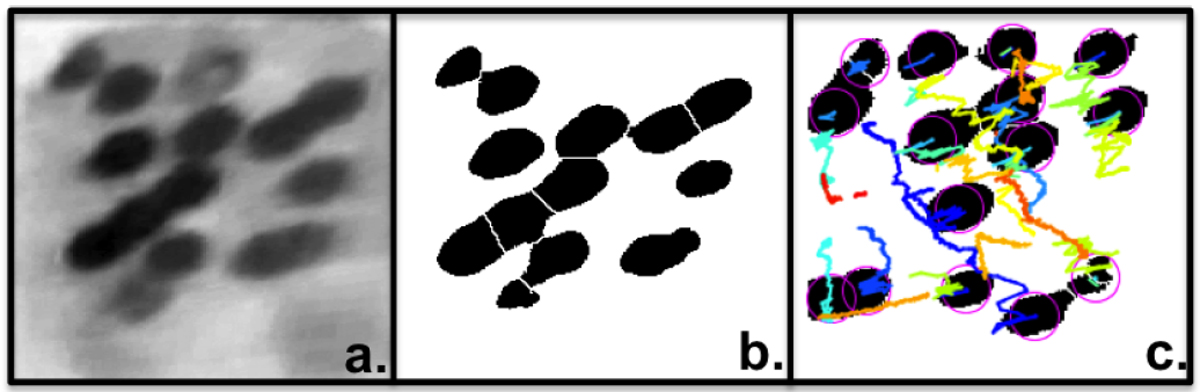
Automated particle tracking. (a) Processed image of tray 1 at the beginning of a shaking cycle. (b) Same image as in (a), binarized. (c) Binarized image of tray 1 at the end of a shaking cycle with the detected particles (purple circles) and tracks (colored lines) superposed. The track colors indicate the point in time during the shaking cycle: bluer colors indicate that the track was detected earlier during the shaking cycle while redder colors indicate later detections.
Current usage metrics show cumulative count of Article Views (full-text article views including HTML views, PDF and ePub downloads, according to the available data) and Abstracts Views on Vision4Press platform.
Data correspond to usage on the plateform after 2015. The current usage metrics is available 48-96 hours after online publication and is updated daily on week days.
Initial download of the metrics may take a while.