Fig. 14
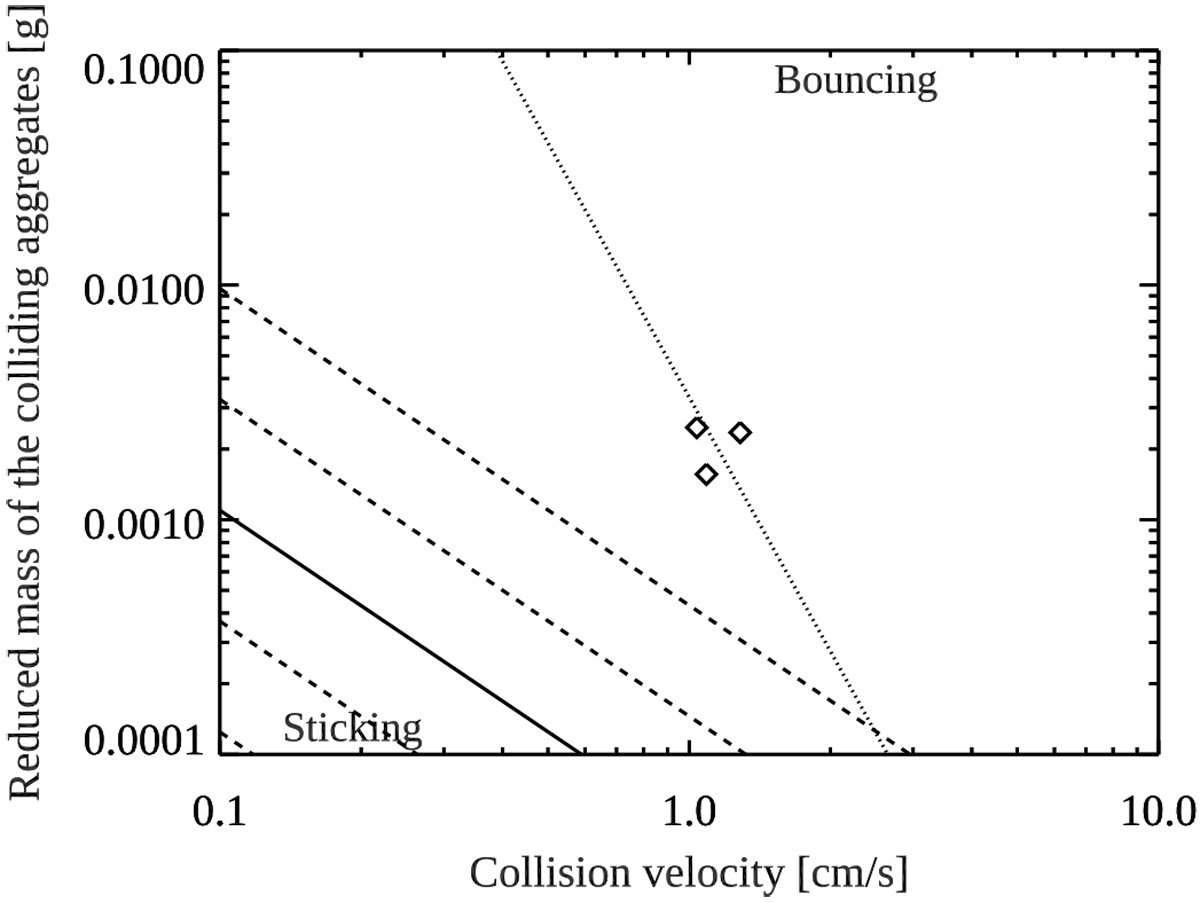
NanoRocks sticking threshold velocity compared to the dust collision models by Weidling et al. (2012) and Kothe et al. (2013). The three points shown (diamonds) are for particles in trays 1, 3, and 5. The dotted line is the 100% bouncing limit from Weidling et al. (2012). The solid and dashed lines are the 100, 75, 50 (solid), 25, and 0% bouncing limits from top to bottom.
Current usage metrics show cumulative count of Article Views (full-text article views including HTML views, PDF and ePub downloads, according to the available data) and Abstracts Views on Vision4Press platform.
Data correspond to usage on the plateform after 2015. The current usage metrics is available 48-96 hours after online publication and is updated daily on week days.
Initial download of the metrics may take a while.