Fig. 12
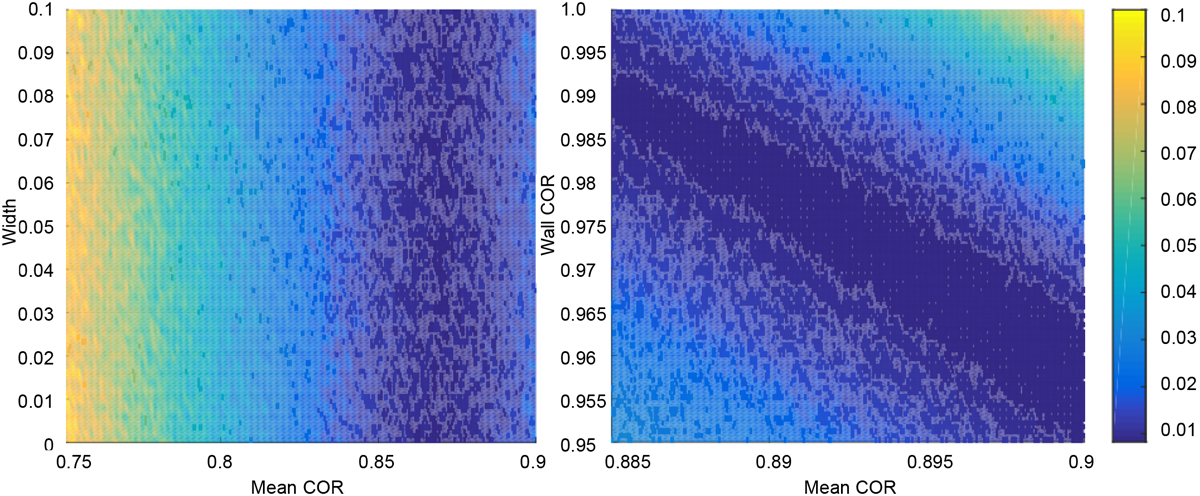
Examples of the search for optimal simulation parameters to match the NanoRocks experiment data. The simulation parameters varied were the average coefficient of restitution and width of the uniform distribution for inter-particle collisions and the coefficient of restitution for particle-wall collisions (considered constant). The colors indicate the average χ2 between the average simulation and experiment data (red and green curves in Fig. 11, respectively), with bluer colors indicating better matches. We search the parameter field for the average inter-particle coefficient of restitution (COR) and the particle-wall coefficient of restitution (Wall COR, right) and between the COR and the width of the COR uniform distribution (left). We observe a degeneracy in the optimal matches with several parameter configurations leading to the same velocity profile as observed in the NanoRocks experiment.
Current usage metrics show cumulative count of Article Views (full-text article views including HTML views, PDF and ePub downloads, according to the available data) and Abstracts Views on Vision4Press platform.
Data correspond to usage on the plateform after 2015. The current usage metrics is available 48-96 hours after online publication and is updated daily on week days.
Initial download of the metrics may take a while.