Fig. 11
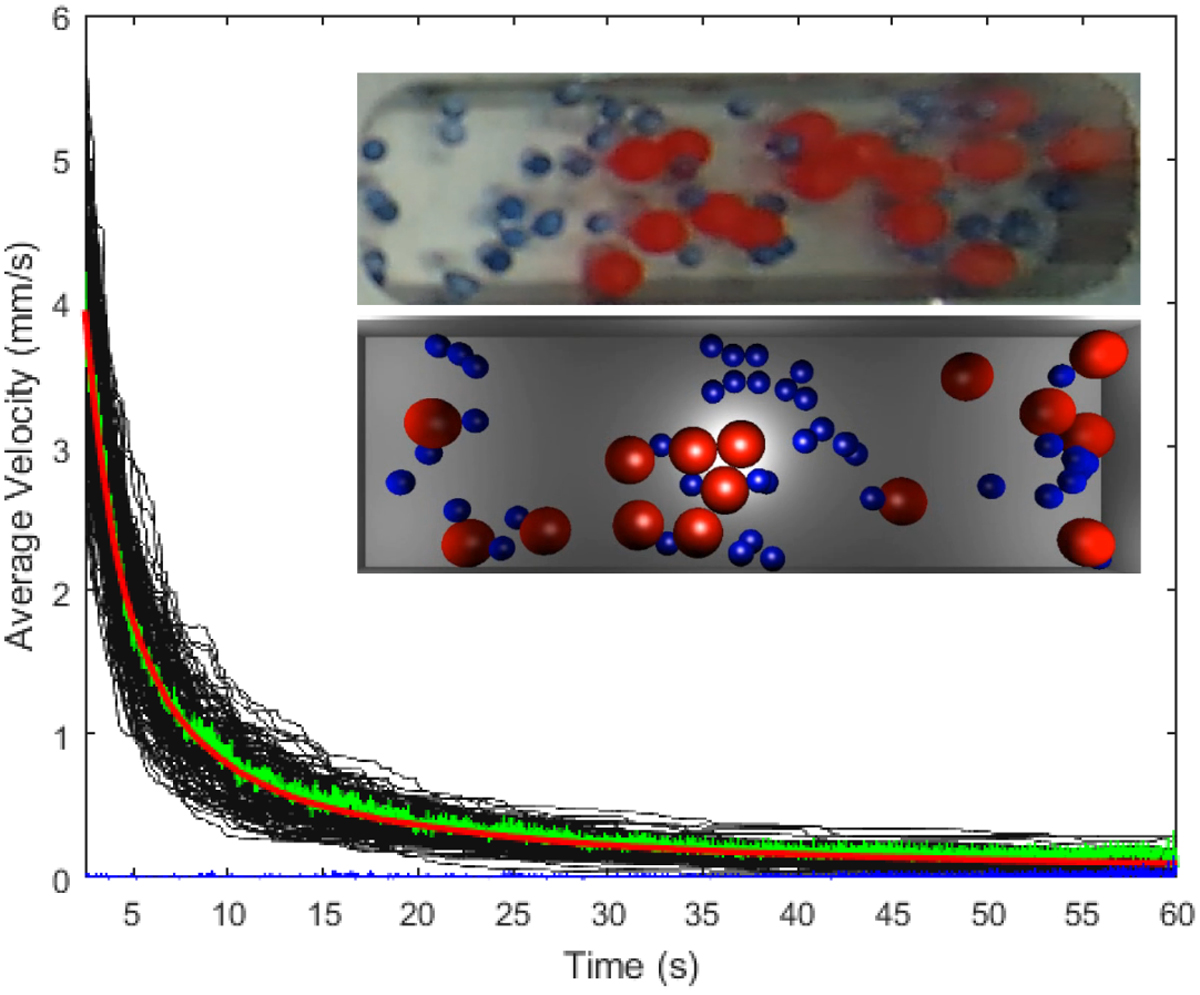
Computational simulation results for the particle velocity evolution over time inside tray 1. Black curves show individual simulation runs and the red curve the average over 178 runs (the number of experimental runs available in the NanoRocks data set). The green curve shows the average particle speed inside tray 1 computed with the statistical analysis (see Sect. 3.1.2). The shaking event was shifted to match the time of simulation start. The χ2 deviation between the simulated and measured average curves is shown in blue (mean value 7.10−3). The coefficient restitution for collisions between particles was set to 0.89 and for collisions with the cell walls at 0.99. The inset shows a visual of the simulation in tray 3 (bottom) compared to the NanoRocks data (top).
Current usage metrics show cumulative count of Article Views (full-text article views including HTML views, PDF and ePub downloads, according to the available data) and Abstracts Views on Vision4Press platform.
Data correspond to usage on the plateform after 2015. The current usage metrics is available 48-96 hours after online publication and is updated daily on week days.
Initial download of the metrics may take a while.